
The oil sector has pulled back roughly 20% over the last four weeks. It's been an aggressive move down, and I was interested to hear that Mark Fisher thinks the bottom is in for oil. MBF trading is a big deal. He is a brilliant man, so I definitely want to check my work.
When you pull up the chart of light crude oil ($WTIC), it is on what looks like a sell signal. But the price action this week was pretty strong compared to the rest of the market. The relative strength downtrend in purple did try to tick up this week. The full stochastic oscillator (Full Sto) is turning up to a buy signal.
Price is making an inside bar, which can be an indication of indecision. If it can start to make higher highs here, that would be a textbook bounce off the uptrend. The percentage price oscillator (PPO) is at one of the most interesting points—a potential buy. When the PPO breaks above this long six-month downtrend, you may want to be long crude.
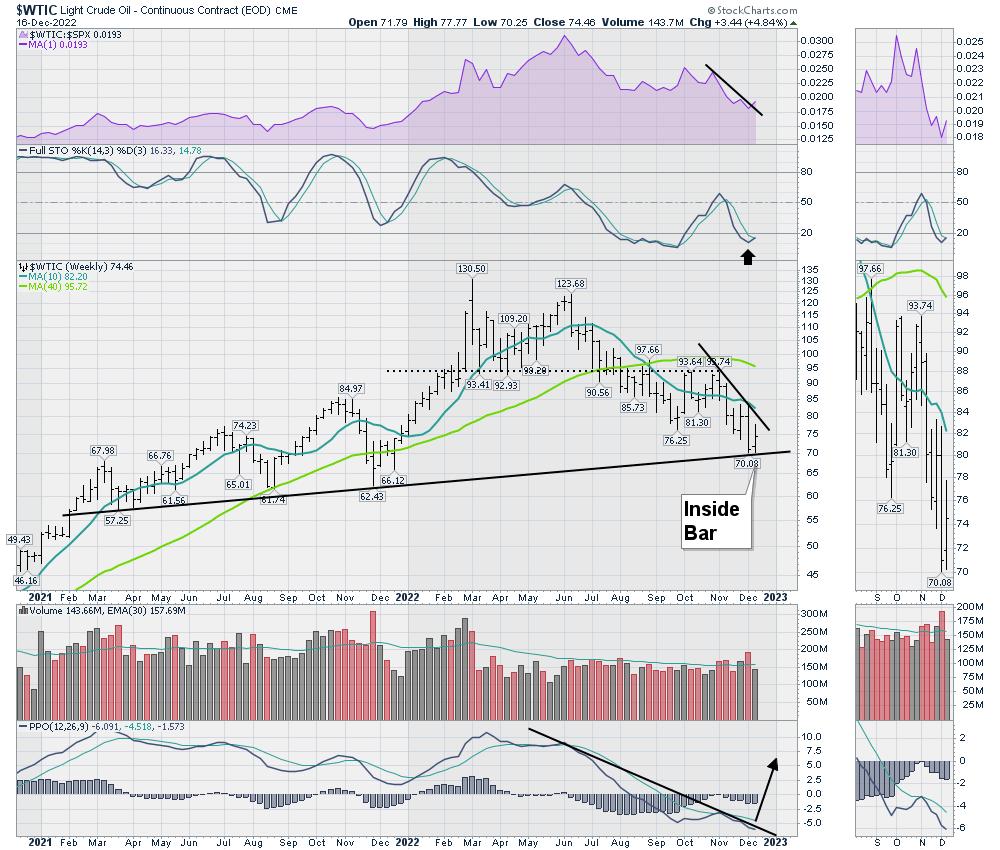
CHART 1: IS CRUDE READY FOR AN UPTREND? The full STO and PPO indicators look to be getting ready to turn up and price is making an inside bar on a bar chart. Chart source: StockCharts.com. For illustrative purposes only.Commodities
If you bring up a chart of the $CRB, it appears to be broken. If it were to reverse higher here, it would be a false breakdown. When a breakdown reverses, it's a very bullish signal.
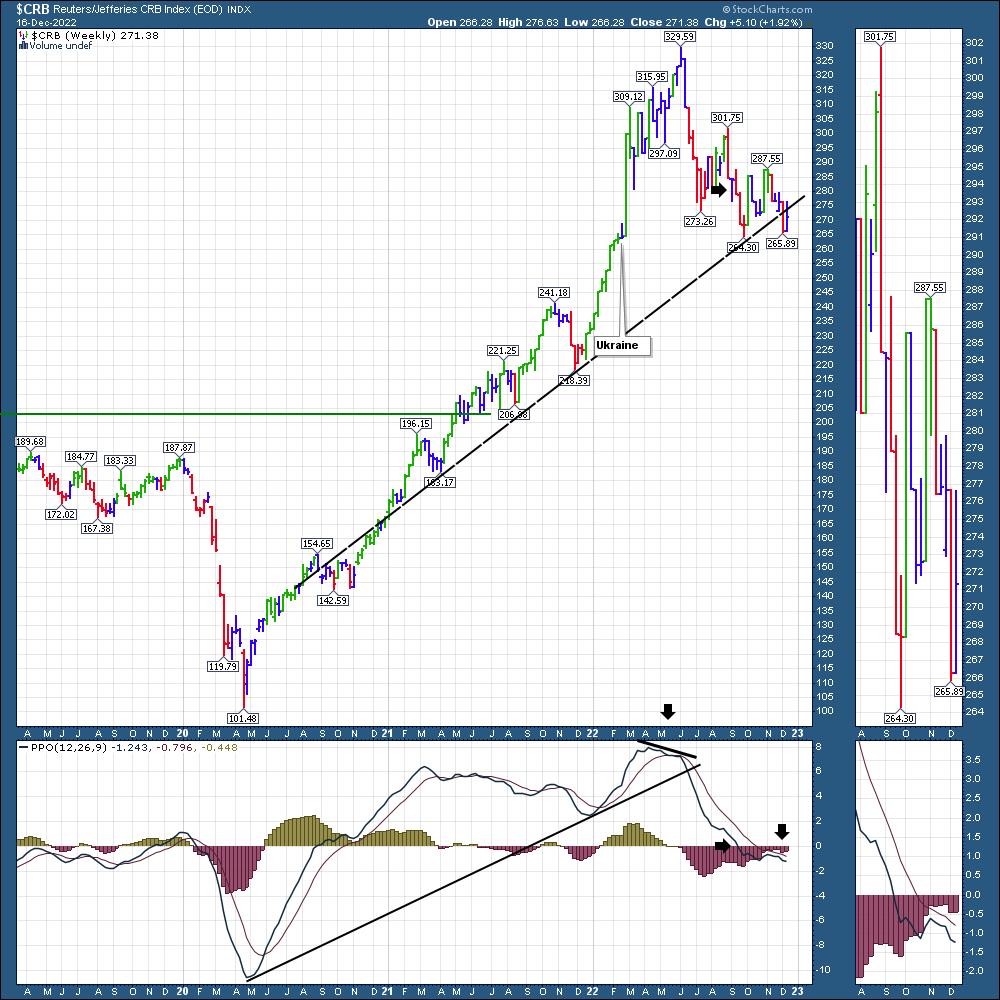
CHART 2: LOOK FOR AN UPWARD MOVE IN COMMODITIES. If the trendline breakdown reverses it could be a bullish signal. Chart source: StockCharts.com. For illustrative purposes only.
I prefer to buy commodities near the lows. If these charts can improve, that would be bullish. The stock market last year dropped through the first quarter, but the oil markets kept rallying. The real question is—if that same market action endures—can oil rally in the face of the slow economy?
Oil and Gas Exploration
The SPDR S&P Oil & Gas Exploration & Production ETF (XOP) is hanging on the trend line. Right now, everything on the chart is pointed down. The fast move from $160 to $130 could be a normal pullback in an uptrend, but, if the price doesn't hold this trend, it can move down extremely fast. Last December, the indicators were in a similar position, and they all started to turn up from there on a nice rally.
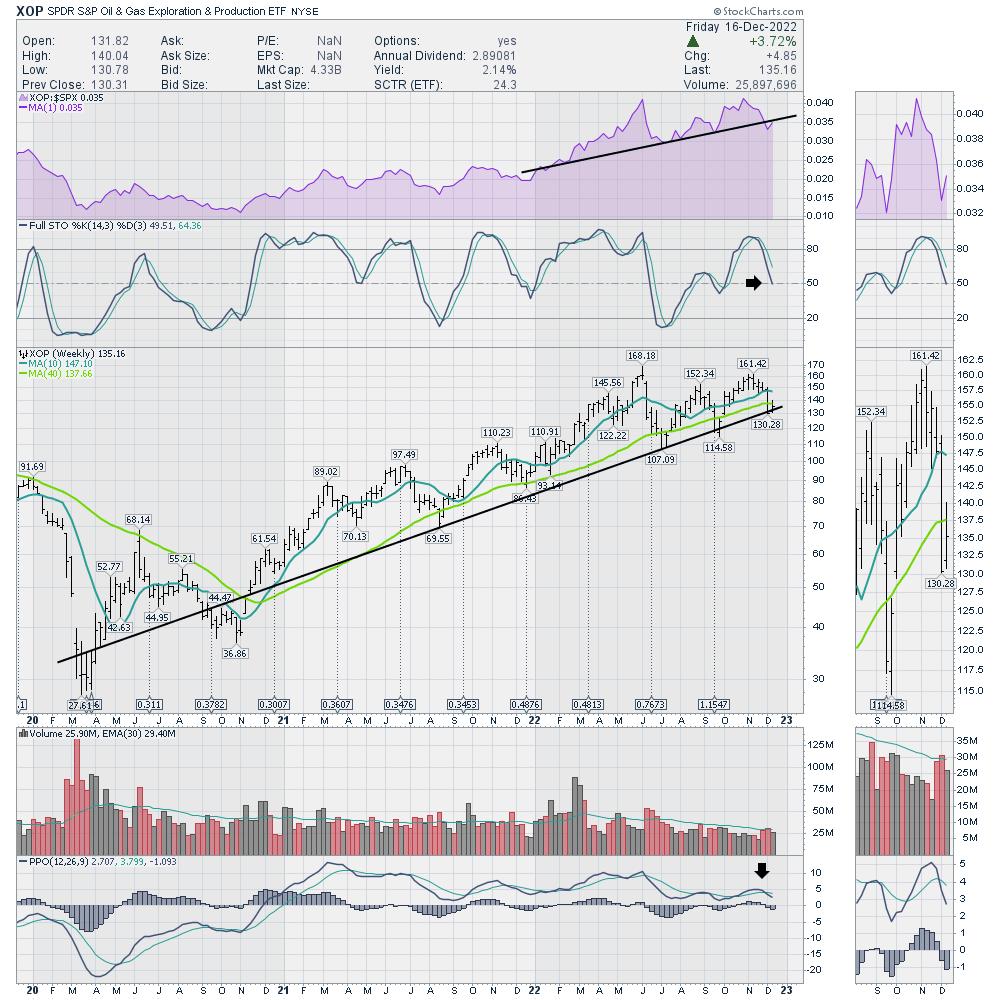
CHART 3: XOP IS AT A CRITICAL JUNCTURE. If XOP were to break below its trendline, it could fall even further. Chart source: StockCharts.com. For illustrative purposes only.
With the overall stock market failing, it really is a tough call. But, for investors who like to buy at the trend line with a close stop, this looks like a nice location. I think the close stop is critical. If this chart continued to make lower lows, it wouldn't be worth looking at. It's the indecision at the trend line that suggests this might be ready to turn higher. So, keep an eye out for a reversal in energy stocks and ETFs.
Good trading,
Greg Schnell, CMT, MFTA
Senior Technical Analyst, StockCharts.com
Author, Stock Charts For Dummies
Want to stay on top of the market's latest intermarket signals?
– Follow @SchnellInvestor on Twitter
– Connect with Greg on LinkedIn
– Subscribe to The Canadian Technician
– Email at info@gregschnell.com


