Energy stocks got rocked this week. Inventory data doesn't seem to matter. Russia doesn't seem to matter. For me, the charts have been weak for a while, but they got hammered this week.
XOP
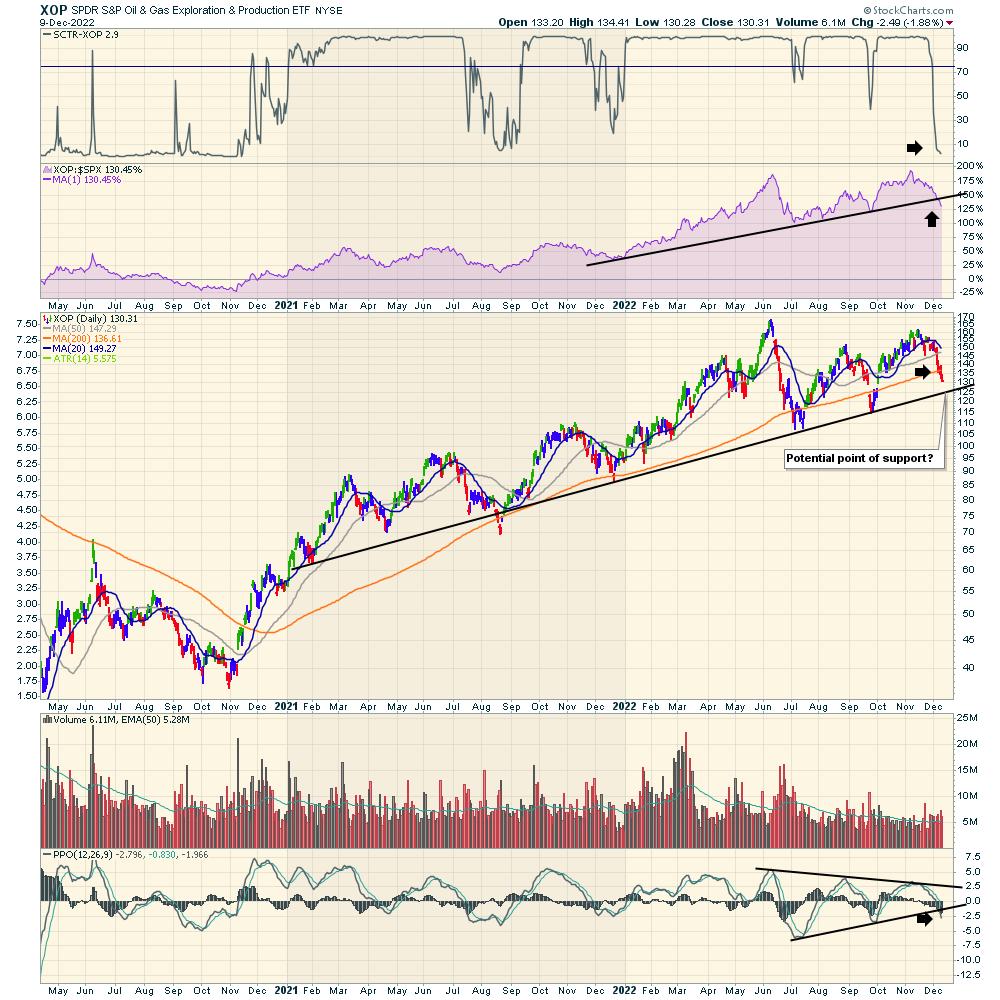
XOP was down on the week but, more importantly, the indicators are all breaking down.
- The SCTR is a relative ranking of how strong the price action is compared to other ETFs. It is currently one of the worst charts for price action, as it is only outperforming 2.9% of the ETFs.
- Relative strength compared to the $SPX has been declining in a straight line for 5 weeks.
- Price has fallen below the 20-, 50-, and 200-DMA. It looks awful. Eventually there will be a bottom, but none of the moving averages have worked so far.
- Volume is above average on most selling days.
- PPO - a momentum indicator is pointing straight down at this point.

XOP extended range
When we zoom out on this chart, a few more important things show up.
- This is the lowest SCTR level of the year. Actually, this is the lowest rating since oil started to rally in 2020!
- The 2022 relative strength up trend is firmly broken.
- Looking at the price chart, there is a trend line that may provide potential support. More on that later.
- The PPO has been coiling for the last 6 months and now is breaking down. This breakdown just started, so it would be very early to start betting on upside here.
XOP weekly
When we look at the weekly chart, this looks like a long-term transition point.
Compare point 1 to point 3. Notice most of the indicators failing in a similar manner. The full stochastic has a different look when comparing, but it is breaking down. Point 2 was when everything got bullish.
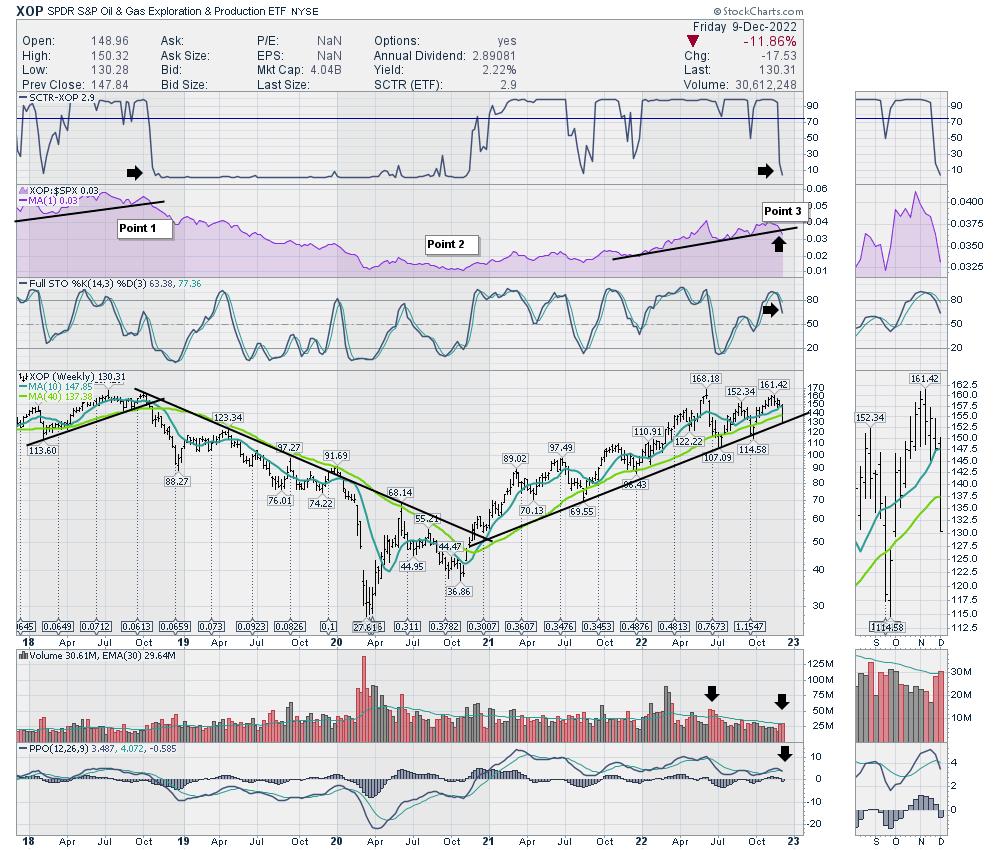
There is never an exit sign at the top, but there is an exit on a chart. Emotionally, it's hard to sell winners when the 'fundamentals' look bullish. But that is why the chart made it to a high point. Investors are sniffing this out as changing conditions.
Clients at Osprey Strategic were cautioned on energy for 5 weeks. It has been working lower, but this week was a drain opening in the energy bathtub. For the broader market, clients have been on hold for two weeks before the big move down, protecting profits. If you are not aware of the PLUMB system, and would like more information, try a one-month subscription for $7. It can really help protect profits in a timely manner!
Good trading,
Greg Schnell, CMT, MFTA
Senior Technical Analyst, StockCharts.com
Author, Stock Charts For Dummies
Want to stay on top of the market's latest intermarket signals?
– Follow @SchnellInvestor on Twitter
– Connect with Greg on LinkedIn
– Subscribe to The Canadian Technician
– Email at info@gregschnell.com


