A month ago, the Nasdaq Chart was in the bottom right corner. Tech layoffs were being announced, and the CEO/CFO/CIO teams were preparing for a terrible 2023. A month later, the market looks almost silly, rocketing to new multi-month highs. But here's where it gets tricky; you needed to buy what no one was interested in at the end of the year.
Hindsight is 20/20, but let me explain.
Look at the Worst 300 Stocks
So what did you need to buy to do well this year?
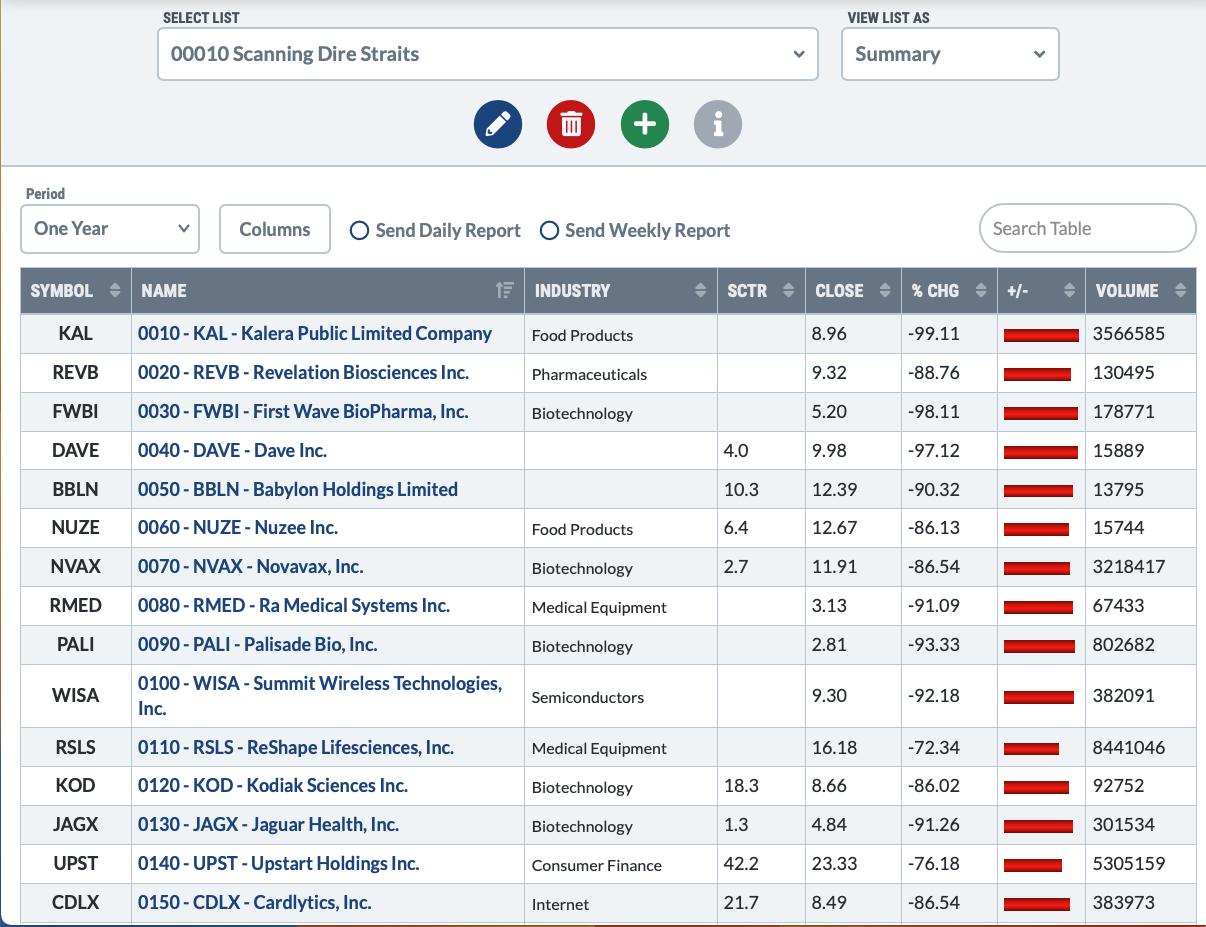
Below is a sort of stocks down more than 60% last year (ending December 31) and ranking them by the worst performers (0010) to best of the worst (0300). I added a series of numbers keeping this sort order. The sort order is based on the scan (0010, 0020,0030 in the name column) and last year's worst stock is at the top of the chart).
Please note the red bars on the picture below shows the one-year performance (Feb 3, 2022 to Feb 3, 2023) as of February 3rd, not year end. Also note the name of my scan results folder!
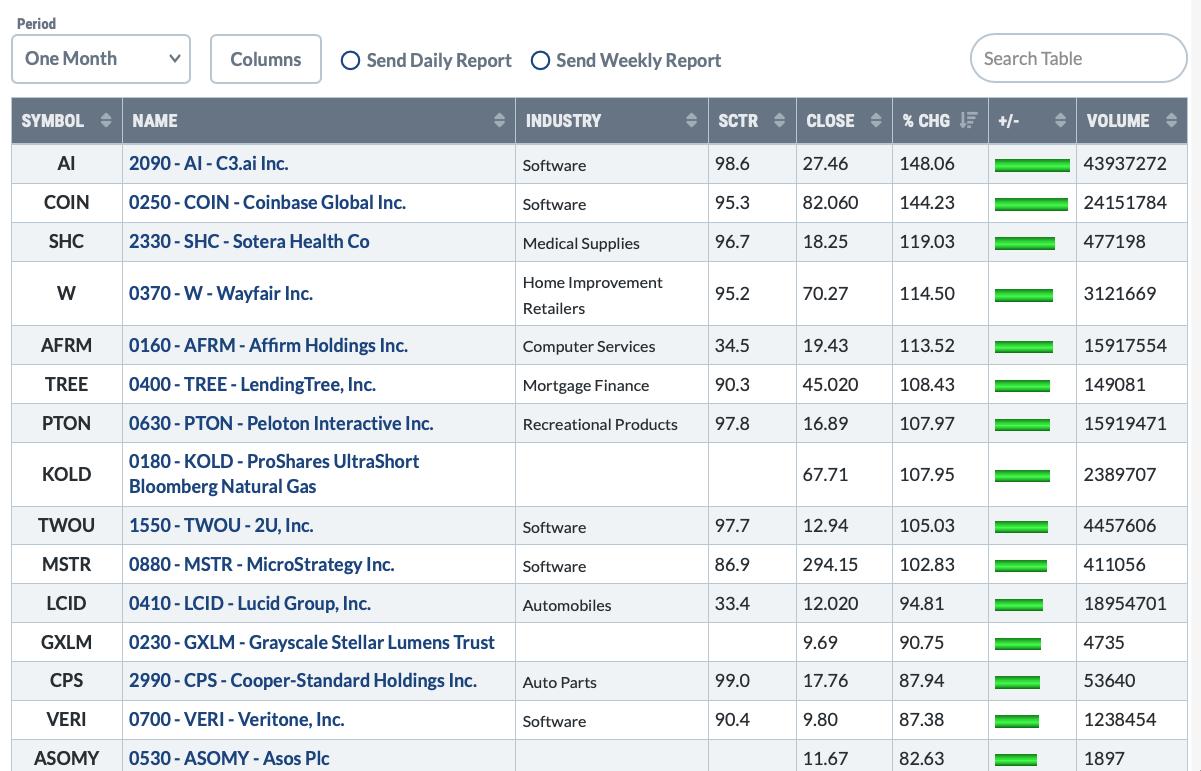
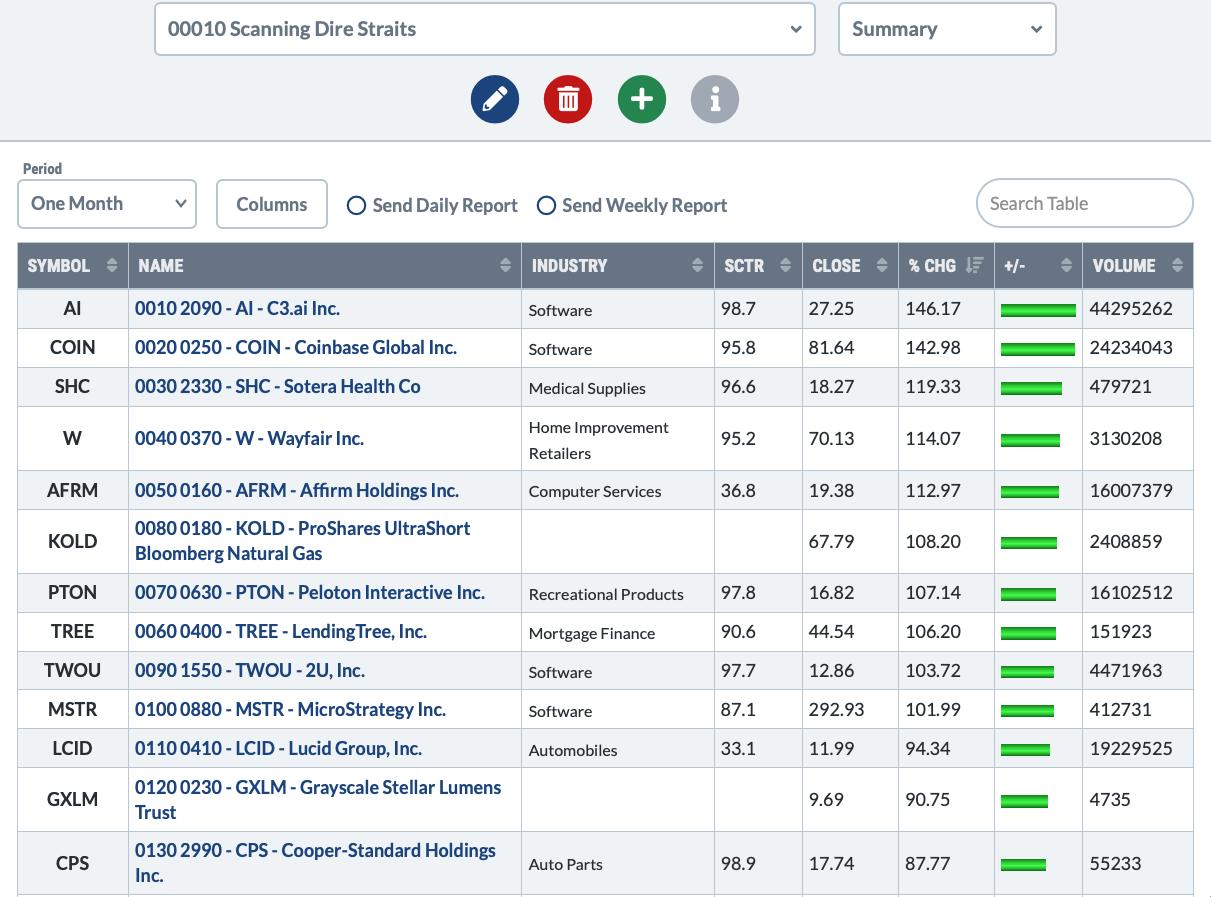
When we sort those same names by the largest up move over the last month, we get this picture from the same 300 stocks. The green bars show the percentage change. What I find fascinating is that many of the worst 300 stocks of last year in the USA are up 5x or 10x over how much the index ($SPX = 8%) is up in the first month of the rally.
Just to keep this straight now, I've added a second column of numbers on the list below.
- The second column of numbers was the rank of how awful they were; 0010 being the worst stock and 0300 being the best of the bad bunch.
- The first column of numbers is the current leadership of that group over the same month; 0010 being the best stock and 0300 being the lowest performer.
C3.ai
To explain a little further - for C3.ai -
It was the 209th stock out of 300. It wasn't the worst stock of the worst 300 losers, but it was ranked 209th (2090) meaning 208 stocks were worse.
Now, C3 is first, so 0010.
Coinbase
Coinbase was one of the worst 25 stocks (0250 in the second column), but is now 2nd in the move up.
It can be confusing so let me try to explain it again.
On the picture above there are two numbers at the beginning of the name.
- The first is the current ranking from best to 300th shown as (oo10 - to 0300).
- The second is the worst stock of the year ranked from 0 to 300 (0010 to 0300).
A stock like TREE was 40th worst stock of the year (0400), and is the top 6 (0060) in this group for the best one-month performance -- up 106%.
StockCharts does not have a way for me to post the complete PDF here, but I've posted the same article on ospreystrategic.org and you'll be able to download the PDF from there.
I'll be doing a presentation to show how we operate in the market during rallies and downturns. If you would like to learn more, follow the link for free registration: Osprey Strategic Information Session.

The bottom line is that, when the market turns higher, staying in the 'safe' names might just lead to a massive underperformance. I'll be adding this scan to my tool box for major lows.
Good trading,
Greg Schnell, CMT, MFTA
Senior Technical Analyst, StockCharts.com
Author, Stock Charts For Dummies
Want to stay on top of the market's latest intermarket signals?
– Follow @SchnellInvestor on Twitter
– Connect with Greg on LinkedIn
– Subscribe to The Canadian Technician
– Email at info@gregschnell.com


