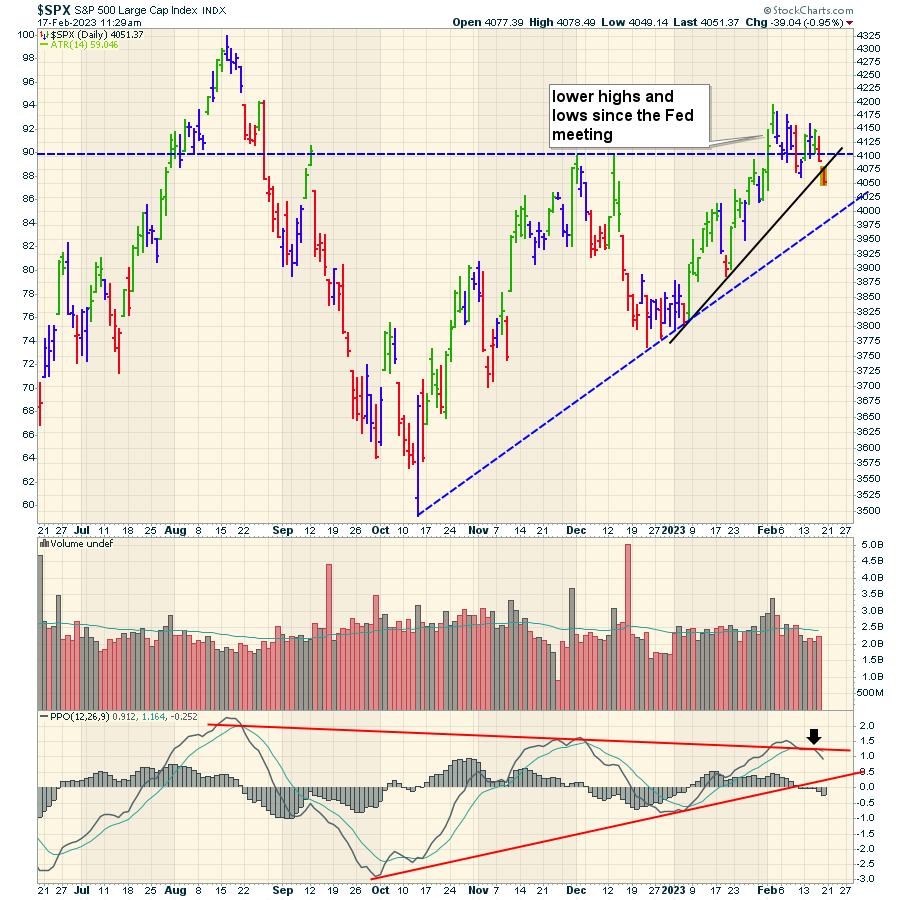
Every bull market always has something that is missing. The market starts in a narrow group of industries, then broadens out. Since October, the market has been rallying, and February has seen a sideways trend develop.
One of the big opportunities we are facing as a society is the rate of change moving from fossil fuels to electric. I continue to expect an oil supply short fall to be a problem, as old fields expire and new exploration is not being pursued. Marginal production from reservoirs like the Bakken and Permian are topping out at this price level.
The chart of the exploration and production ETF is testing the uptrend line to end the week on options expiration day. Is there enough oil and gas demand to get this trend of lower highs since November to reverse? The larger picture shows declining volume, suggesting investors are focused elsewhere for more gains.
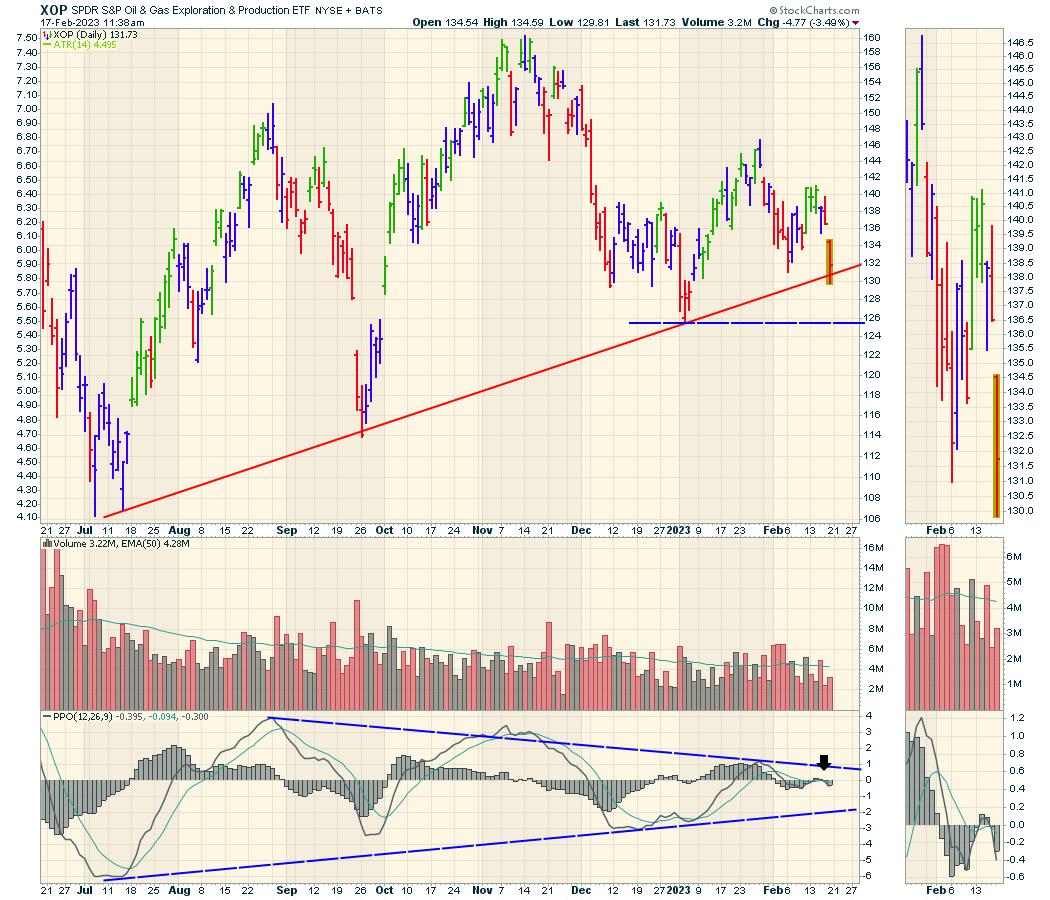
The PPO has rolled over at zero and is in negative territory again. The PPO wave in January barely made it into positive territory. So far, the chart looks concerning. Do we buy it on the test of the uptrend, or is the economy weakening under the surface, limiting demand and upside for the liquid energy industry group?
Globally, we are seeing demand come off, with inventory builds starting to show up. Analysis groups like the IEA are predicting increased demand. In my opinion, it is very odd to see the oil charts come off, especially with a tight supply backdrop, if the economy is as strong as we are seeing by labor and spending.
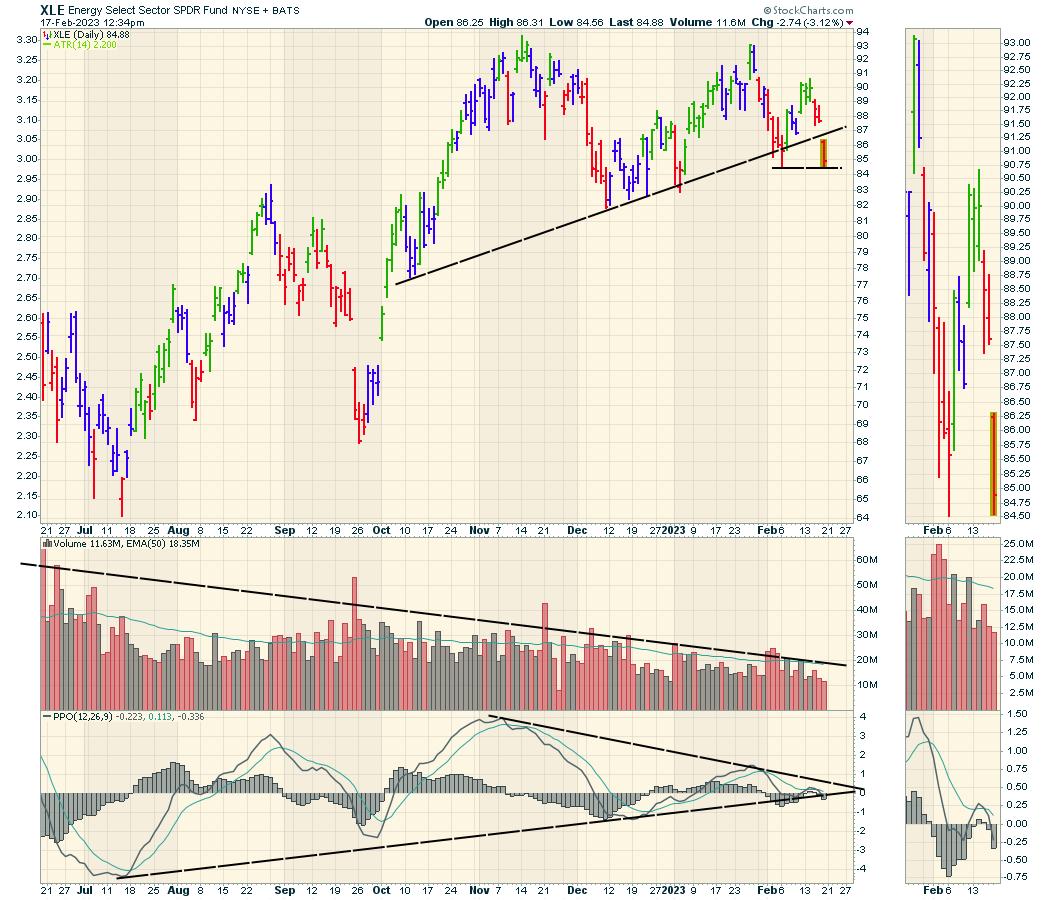
When we broaden out a little to the rest of the XLE, it's a similar look, but testing the recent low. The uptrend seems clearly broken on this chart. The PPO is rolling over at zero, suggesting more weakness ahead. Volume is declining. The PPO trend is being threatened right at the zero level.
For me, I keep wondering, "Why isn't energy part of the rally?" That will continue to bother me. Oil is the world's largest economic indicator, so it needs to revert higher soon if this bull market is going to continue. If it doesn't, does that mean the Fed is starting to succeed at slowing the economy? Good questions that we'll know the answer to shortly.
The Nasdaq 100 and the S&P 500 are both closing near three-week lows on the weekly chart. Stay tuned to see if the economy is weakening as oil suggests.
Good trading,
Greg Schnell, CMT, MFTA
Senior Technical Analyst, StockCharts.com
Author, Stock Charts For Dummies
Want to stay on top of the market's latest intermarket signals?
– Follow @SchnellInvestor on Twitter
– Connect with Greg on LinkedIn
– Subscribe to The Canadian Technician
– Email at info@gregschnell.com


