One of the areas of the market that continues to struggle is oil. OPEC recently pushed the price of WTI crude above a prior high, but that has not held.
I got an interesting email this morning from an oil and gas friend asking why his stock has dropped 20% recently. It was a small Canadian Oil and Gas company, but the same thoughts work across the spectrum.
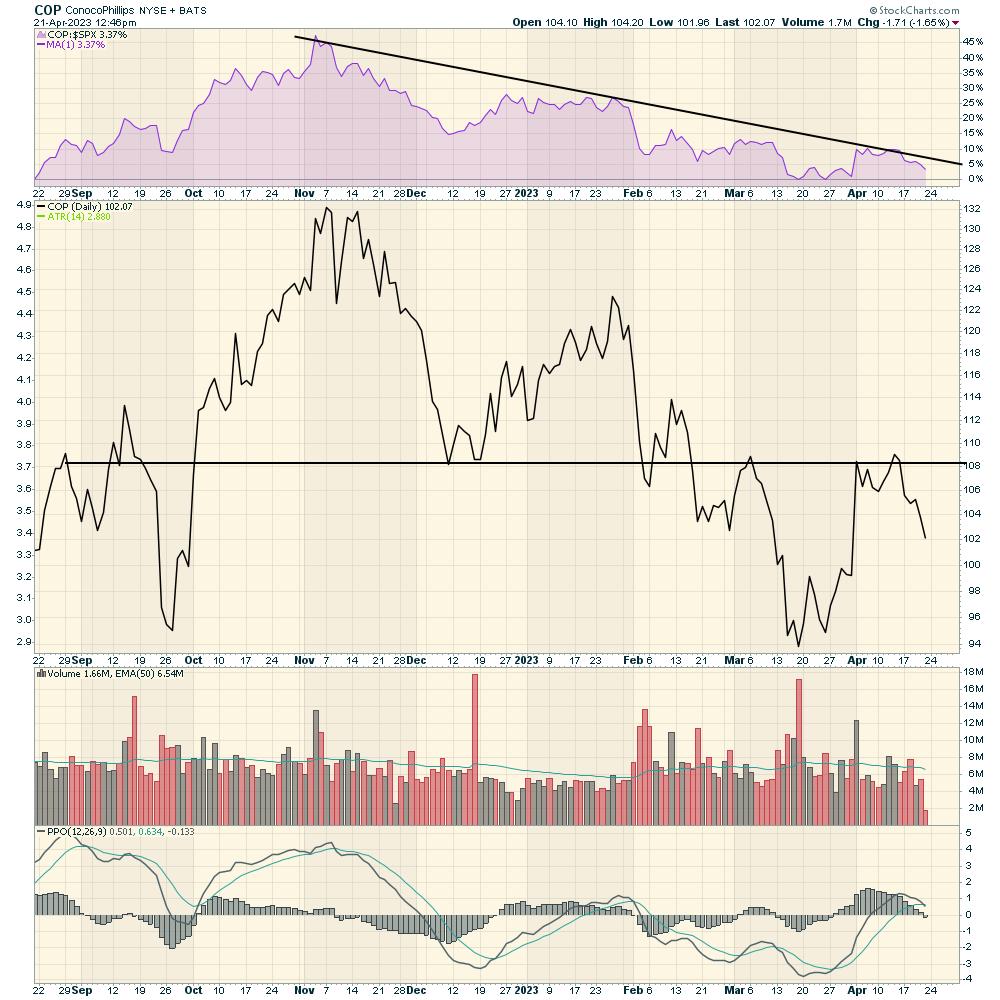
Let's use a company like ConocoPhillips (COP). The stock continues to make lower lows and lower highs. The relative strength shown in purple continues to underperform. Until the stock can start outperforming the S&P 500, it's going to be difficult to attract capital. The outperformance would show when this area chart in purple starts to turn up. Momentum shown by the PPO is rolling over here at a similar level to late January. That could change at any time, but it hasn't started yet.
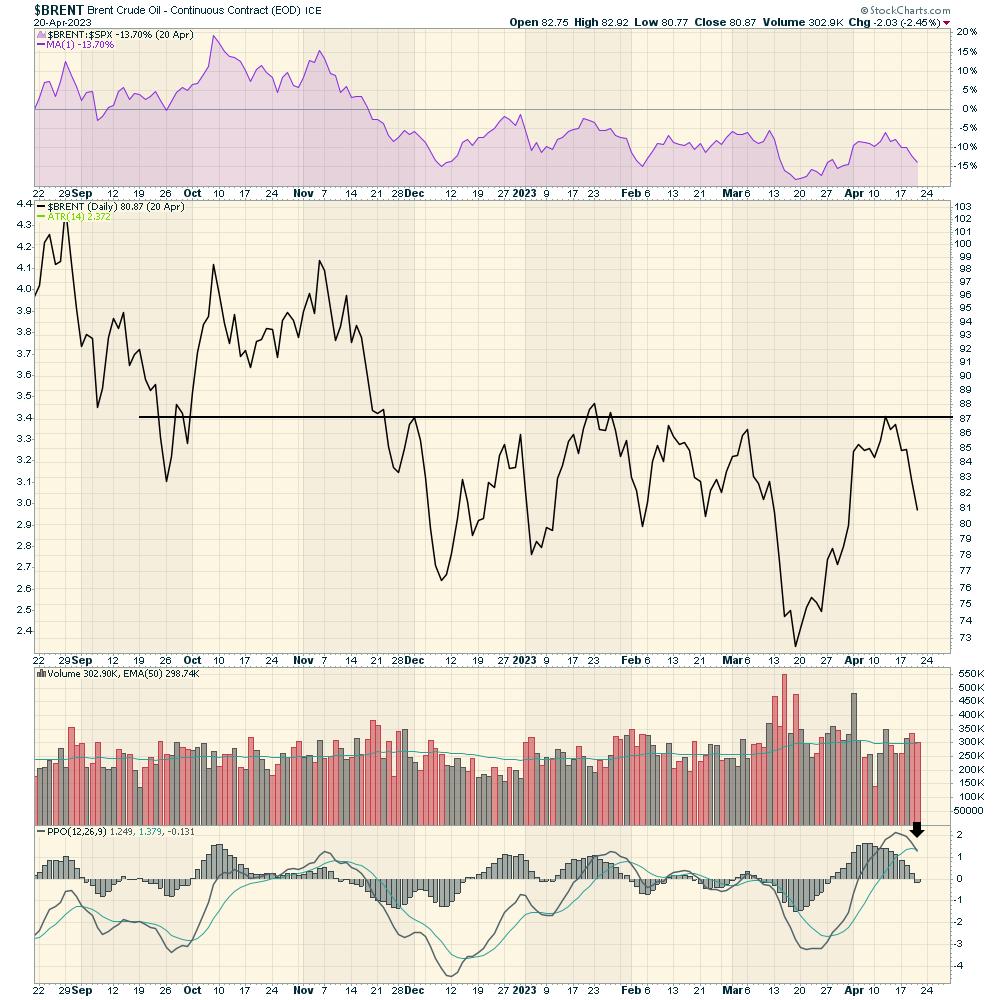
So is this an isolated picture? Let's look at the crude oil markets. Here is Brent crude. Brent continues to underperform the $SPX, and has been stuck with a price high around $87. The recent March move by OPEC got price back up to the highs of the range, but it couldn't break out. Momentum (PPO) is rolling over.
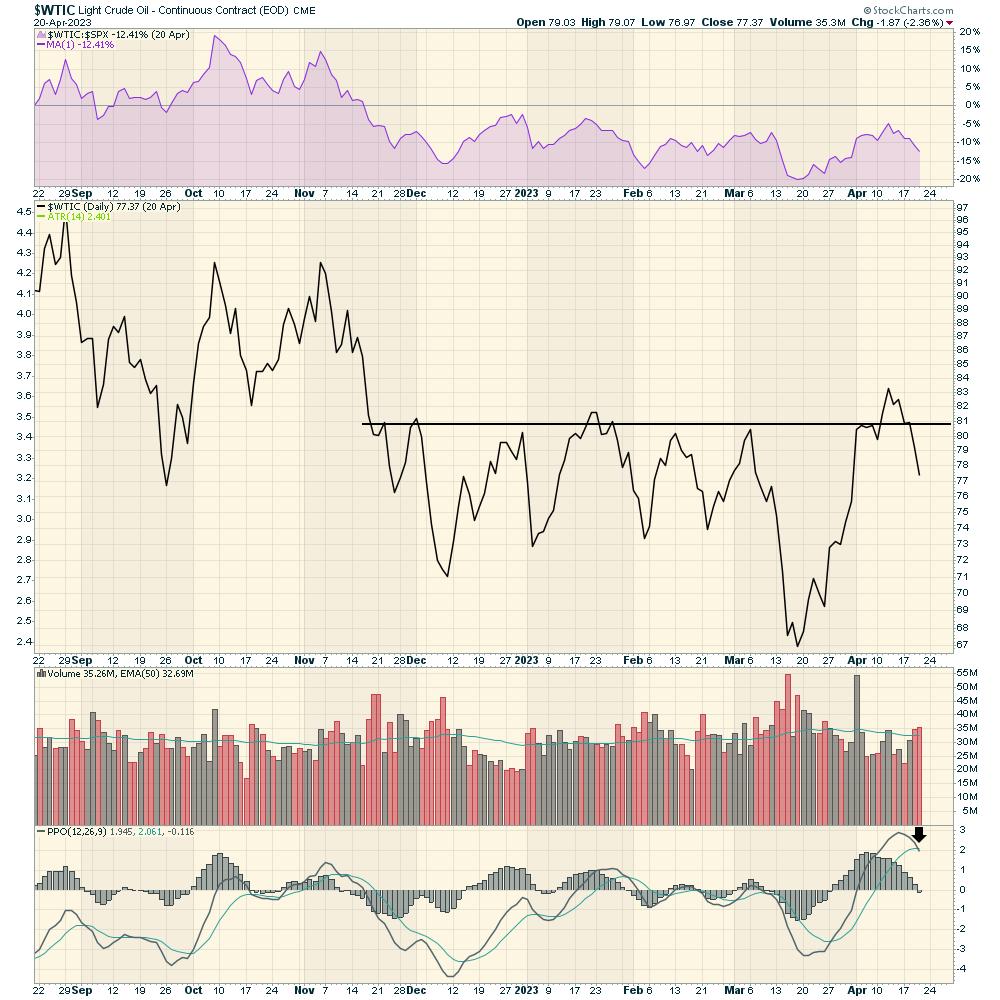
On this side of the world, we focus on WTI. Here is the chart for $WTIC, which continues to underperform the $SPX as well. However, price actually broke out above the previous highs around $81. Currently, this looks like a failed breakout. Failed breakouts are often a better clue as to the direction and, at this point, lower seems to be winning. What would it take to change my mind? If oil can make a higher low and then get back above the $81 level, that makes the price action a lot more interesting. PPO is rolling over, suggesting the momentum is waning.
We can look at the oil producers ETF (XOP), which continues to weaken and has not been able to get back to prior highs, even though OPEC has taken 3 million barrels per day off the market.
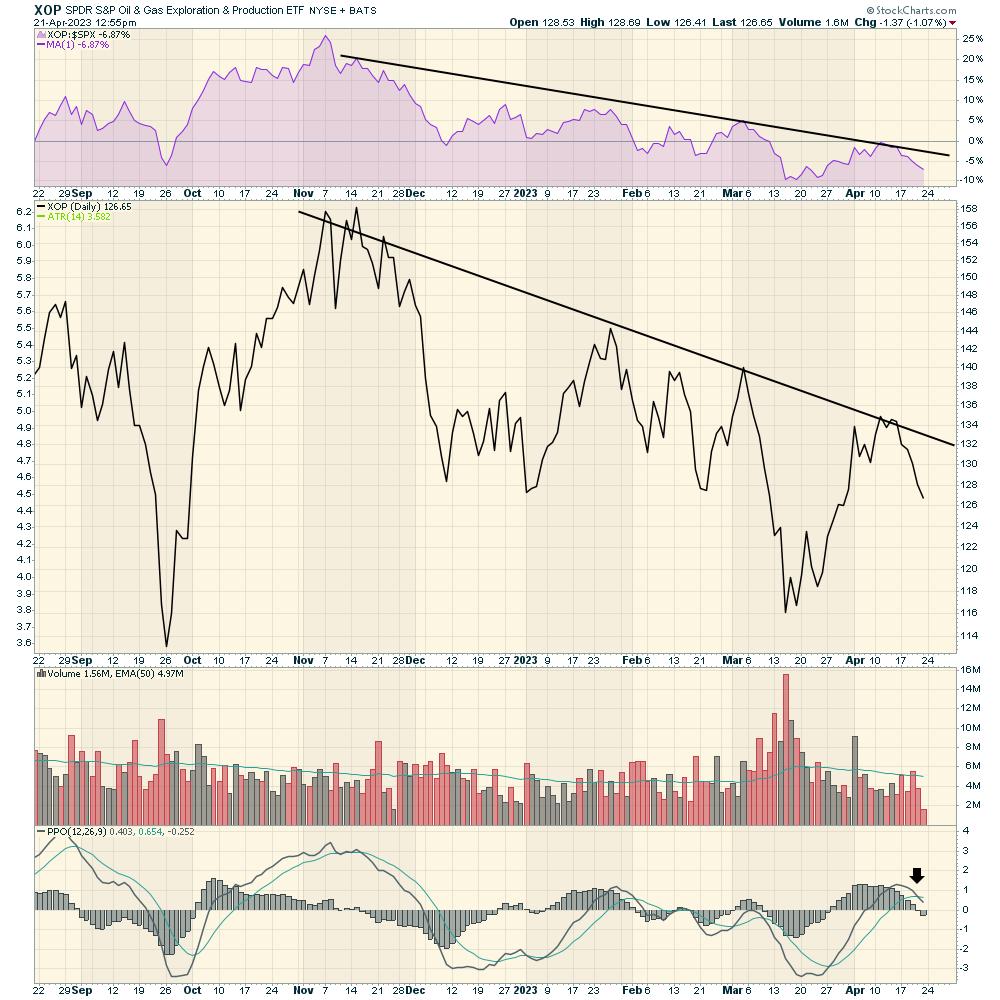
However, for me, oil is one of the better economic indicators, and these charts above all look weak, confirming the problem for the broader economy. Economic activity is declining and oil is telling us, very clearly, that demand is weaker.
When I look at the $SPX, this chart is starting to see what oil is saying. It is testing prior highs, but, after three weeks here, it is struggling to break out so far. PPO is rolling over, and those sell signals have been pretty helpful indicators for upcoming market weakness.
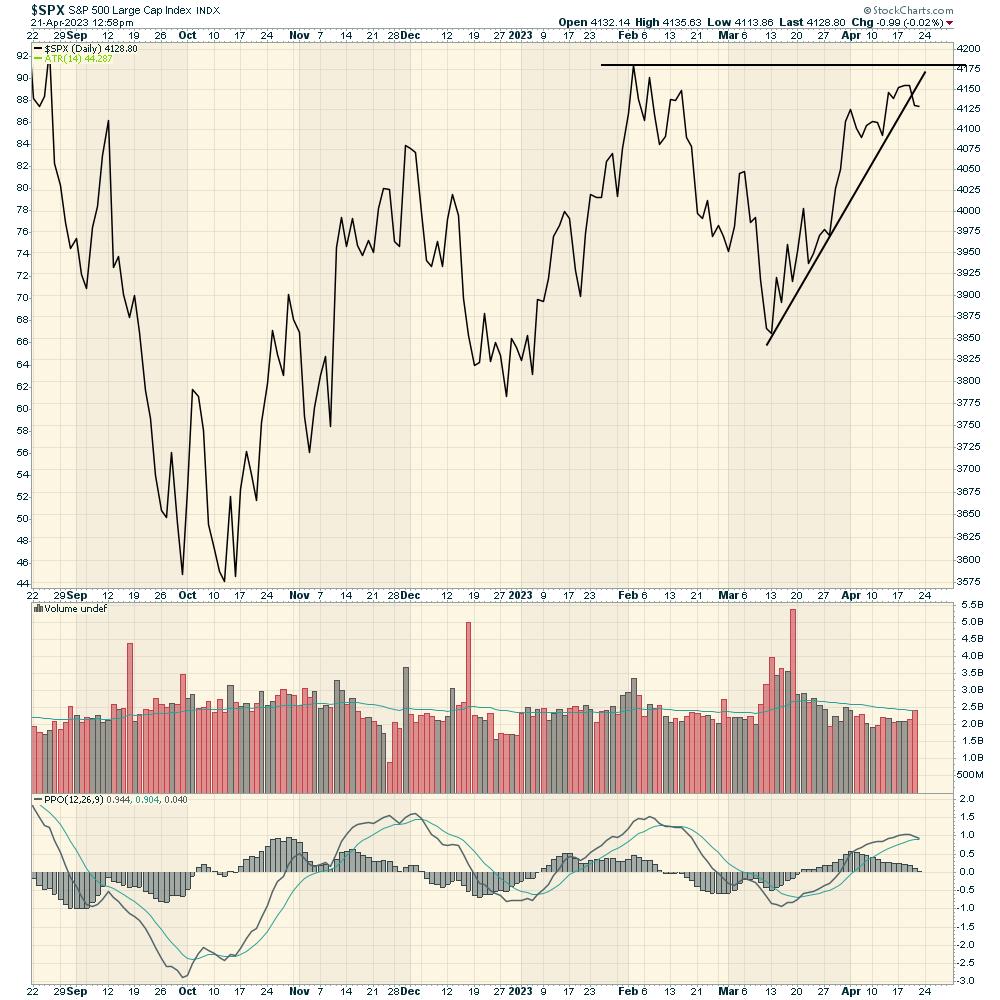
This is not a doom and gloom forecast. It just shows the market is trying to price the economic slowdown, and crude continues to tell us that demand is slowing. When oil and oil producers start to base and breakout to the upside, I'll be a lot more comfortable about the broader economy starting to accelerate.
Good trading,
Greg Schnell, CMT, MFTA
Senior Technical Analyst, StockCharts.com
Author, Stock Charts For Dummies
Want to stay on top of the market's latest intermarket signals?
– Follow @SchnellInvestor on Twitter
– Connect with Greg on LinkedIn
– Subscribe to The Canadian Technician
– Email at info@gregschnell.com


