With seconds to go in the seventh period of the hockey game last night, a goal was finally scored in the Carolina Hurricanes vs. Florida Panthers. It was a long game, a tiring game and only the first game of this playoff series. What we always do, when a game goes on, is we look back in history to see where it ranks. This was the sixth longest game in NHL history. There are six more games in the series. Should be a battle!
Much like the game last night, there are times when stocks go on extended runs, far outside what is expected. The stock breaks into the top echelon of historic moves. When a stock goes on a historic run, there is no real way to know when it will end. Typically, multiple 5% or 10% days close together tell you that you are getting close to the end of a run. Might not be a final run, but it is enough to stop the euphoria for a while. One of the most interesting markets for studying euphoria was the dotcom boom that lasted for years.
Scott McNealy, the CEO of Sun Microsystems, talked about the peak and the valuation of Sun Microsystems at the Nasdaq market top. Bloomberg interviewed Scott in March 2002 looking in the rear view mirror. This was from an interview long after the top, from Bloomberg.
At 10 times revenues, to give you a 10-year payback, I have to pay you 100% of revenues for 10 straight years in dividends. That assumes I can get that by my shareholders. That assumes I have zero cost of goods sold, which is very hard for a computer company. That assumes zero expenses, which is really hard with 39,000 employees. That assumes I pay no taxes, which is very hard. And that assumes you pay no taxes on your dividends, which is kind of illegal. And that assumes with zero R&D for the next 10 years, I can maintain the current revenue run rate. Now, having done that, would any of you like to buy my stock at $64? Do you realize how ridiculous those basic assumptions are? You don't need any transparency. You don't need any footnotes. What were you thinking?
Nvidia
From Twitter this morning, the Price to Sales ratio for NVDA is now 28. You can't believe everything you read on Twitter, so I went to StockCharts NVDA stock summary to check it out. $Market cap of $770B on sales of $27B. That works out to 28 times.All things AI, all things cloud, and NVDA is living in the sweet spot.
Does that mean it will sell off? Absolutely not. Anything could happen. It could double from here. But what could possibly drive a stock to such high market valuations relative to earnings?
Artificial Intelligence (AI)
How the world has changed. I grew up on a farm where AI meant Artificial Insemination. Western Breeders Corp was shipping temperature-controlled packages world wide for AI. But that is a different AI. Today, something has changed, and AI is now artificial intelligence.
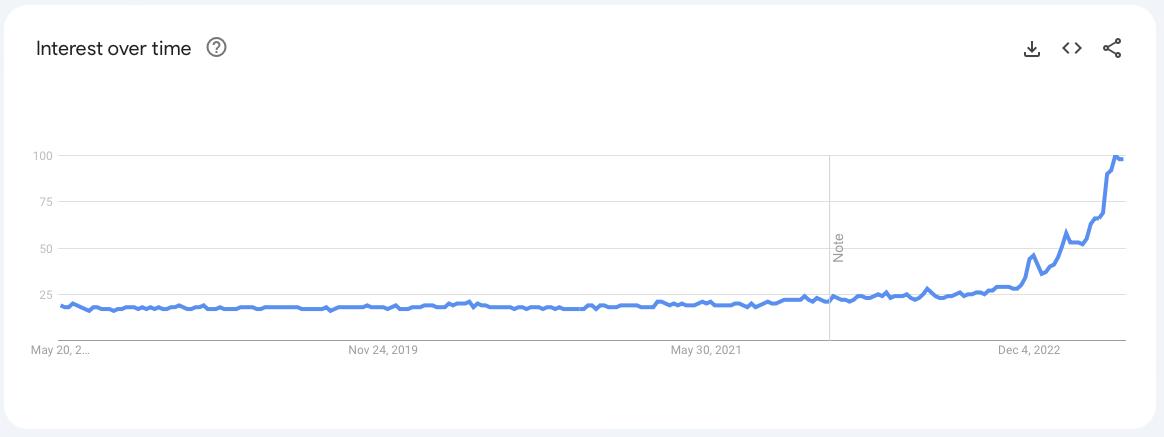
We are entering the big game of AI. When you listen to an earnings call, you go in knowing that every staff writer of earnings talking points has been adding 'AI' to every paragraph. These talking points for the call make sure the world knows the company is ready for the future. This is the search trend for AI over the past 5 years. It only started accelerating in the last 6 months.
The recent SPAC boom lasted 9 months from mid-2020 to March 2021. Remember those heady stock surges? That was a pandemic-induced cash surplus as all the stay-at-home traders wanted to buy the next big thing. What could possibly compare to that run?
How about Nvidia, NVDA? It is a beautiful chart. Next week, we could retest the highs of 2021. The stock had 4 weeks of back-to-back big gains into the 2021 top.
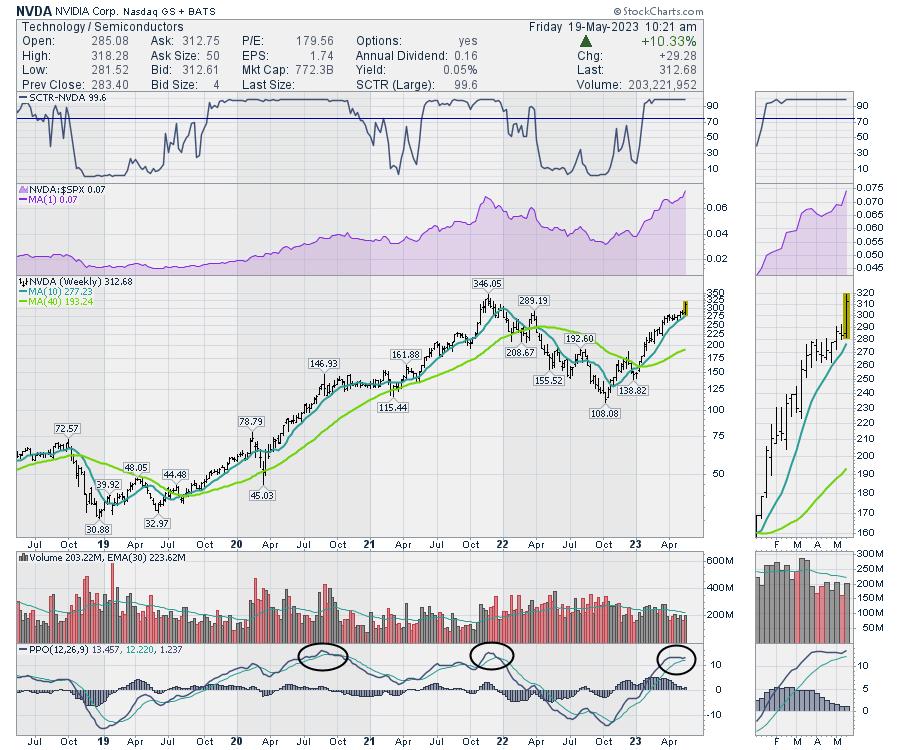
The PPO is very stretched and sitting near the highs of the previous two PPO peaks. Interestingly, the volume is nowhere near as big. I will point out that, in both of the previous big rallies, it was well after a breakout from a consolidation, not the first week after a consolidation, that the stock topped. This could run a whole lot longer.
Overall Market
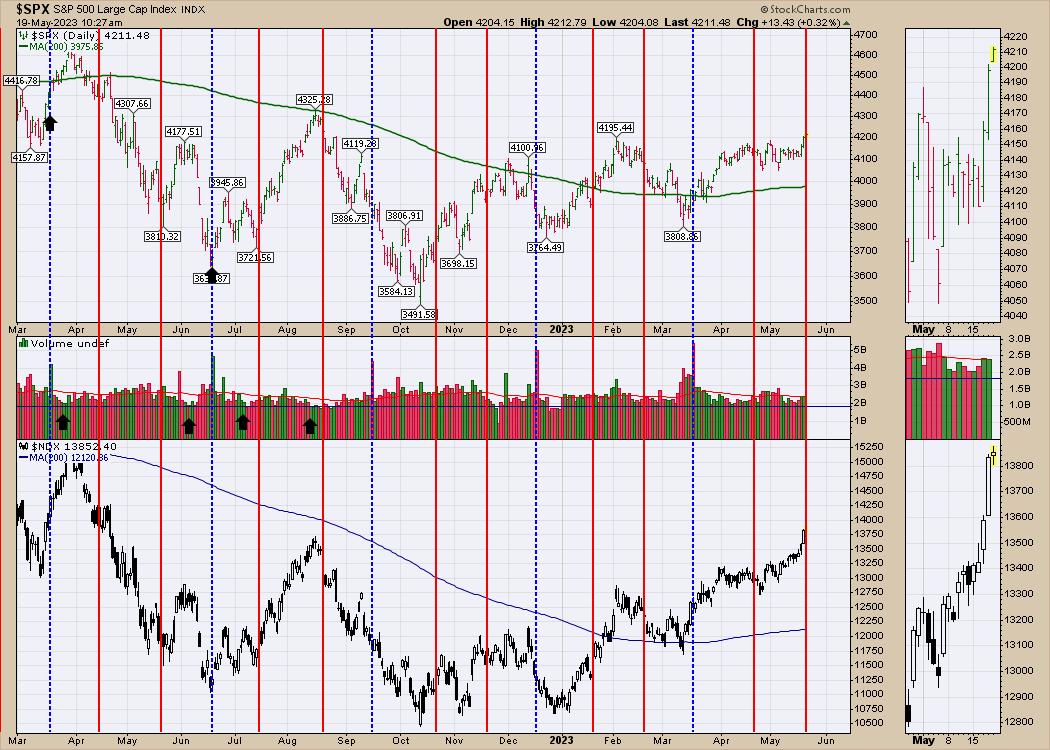
With that said, the market has gone from a sideways grind for 6 weeks to euphoria in 4 days. Has it ever been this euphoric? This is nothing. It is barely the start of a rally. We do not have to look back at history very far. The vertical lines mark the options expirations. Some have been ignored and some have been worth respecting. March 2022, May, June, July, October and March 2023 were nice upside reversals. April 2022, August, December and February 2023 were downside reversals. My only comment is to be aware of the potential for reversals on options expiration.
I am glad we finally resolved to the upside. Quite frankly, looking at the indexes, it looks like higher is the new direction. What is the one fly in the ointment?
Bond Yields
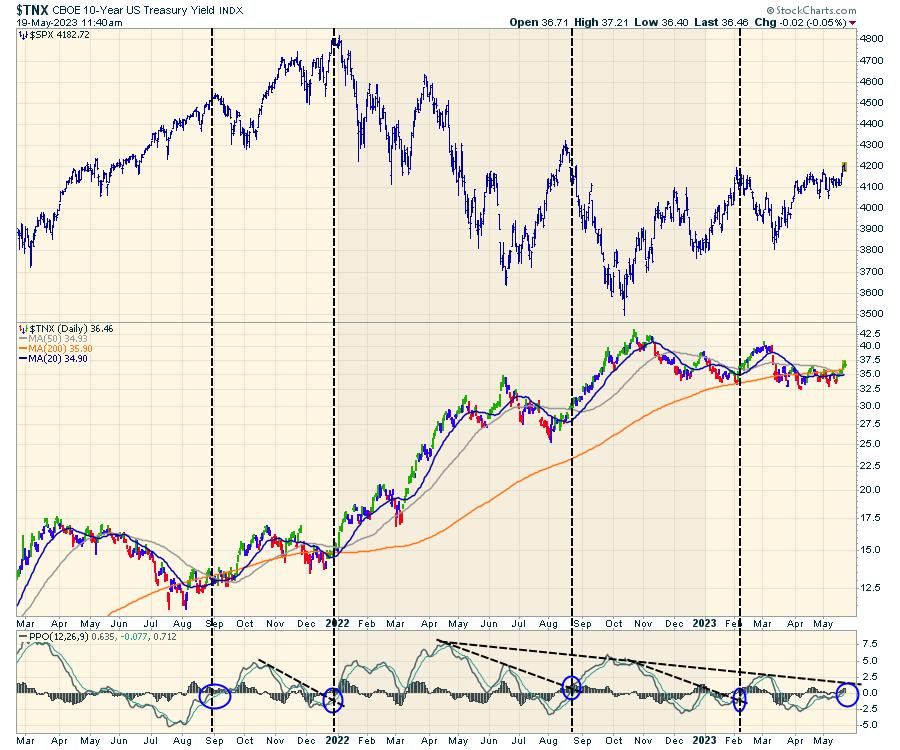
Each week, I look through the charts for intermarket clues as to what is going on. The ten-year yield is starting to accelerate higher. The bottom panel is the yield PPO. When the 10-year Yield PPO moved above zero and/or above a trend line near zero, it also marked some turning points for stocks over the last 1.5 years. We are at that moment on Friday. While I am not able to draw a vertical line on the April 2022 $SPX high, notice how the PPO for the 10-Year stayed above zero all the way to the July low in the equity markets.
The chart has not been able to stall the market, and pessimism is lifting, mine included.
I like the up week we had, with some positive days back to back. Bullish unless we see some of the bond pressure start to dampen stock enthusiasm. Clearly, stocks like NVDA are leading us higher, and that could continue. Banks, energy, software have all turned higher, and I feel like those may be better entries than a semiconductor name at 28x revenue.
More in the weekly newsletter to clients, which is available for $7, covering the first month, at Osprey Strategic.
Good trading,
Greg Schnell, CMT, MFTA
Senior Technical Analyst, StockCharts.com
Author, Stock Charts For Dummies
Want to stay on top of the market's latest intermarket signals?
– Follow @SchnellInvestor on Twitter
– Connect with Greg on LinkedIn
– Subscribe to The Canadian Technician
– Email at info@gregschnell.com


