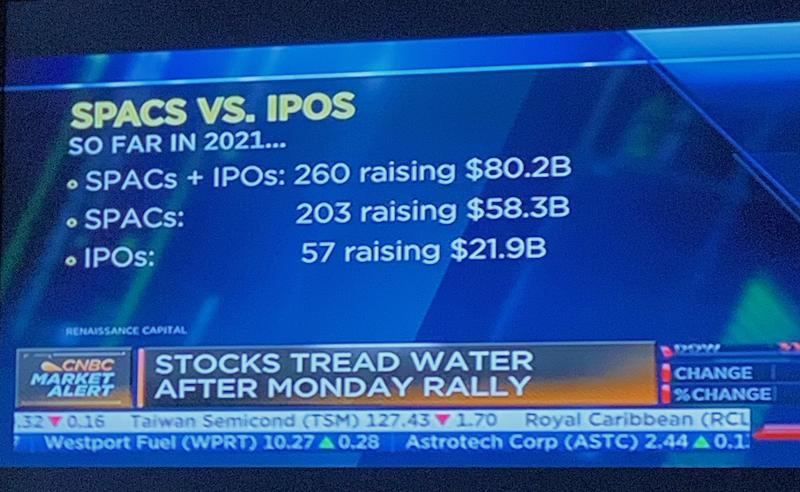
Whenever we get media images marking an extreme in sentiment, it's best to be ready for the exits. Oil after the Russia/Ukraine war was an example.
Remember when SPAC's were a big thing? This image below was from March 02, 2021. Chamath was bringing his Venture Capital investments to market at a relentless rate. He saw the opportunity for him as investors were clamouring to buy the latest growth thing.
A few years ago, CNBC had a Bitcoin tracker running on the screen, tracking Bitcoin's every move. Bitcoin was climbing smoothly, and the peak euphoria seemed to be upon us as technicians. Bitcoin was at $69,000 and there was no end in sight. After 2022, the momentum swung lower and the chart dropped meaningfully. But in November 2022, after the FTX drop, the chart based. It continued to climb in a new uptrend, clearly interrupting the downtrend of 2022. As recently as April 24th, the Bitcoin proponents were back with an interview at CNBC with $BTCUSD going to $100,000. Where is this chart going?
After the April 24th sunshine of Bitcoin going to $100,000 from the level of $27,000, Bitcoin surged for 2 days. Now, Bitcoin has sold off for three weeks and has broken below a small topping formation. The relative strength trend has been damaged, as shown in purple. I ignored the 4-day move down on the banks collapsing, as it didn't seem to be part of any trend on the chart. It did bounce nicely off the 200 DMA in March.
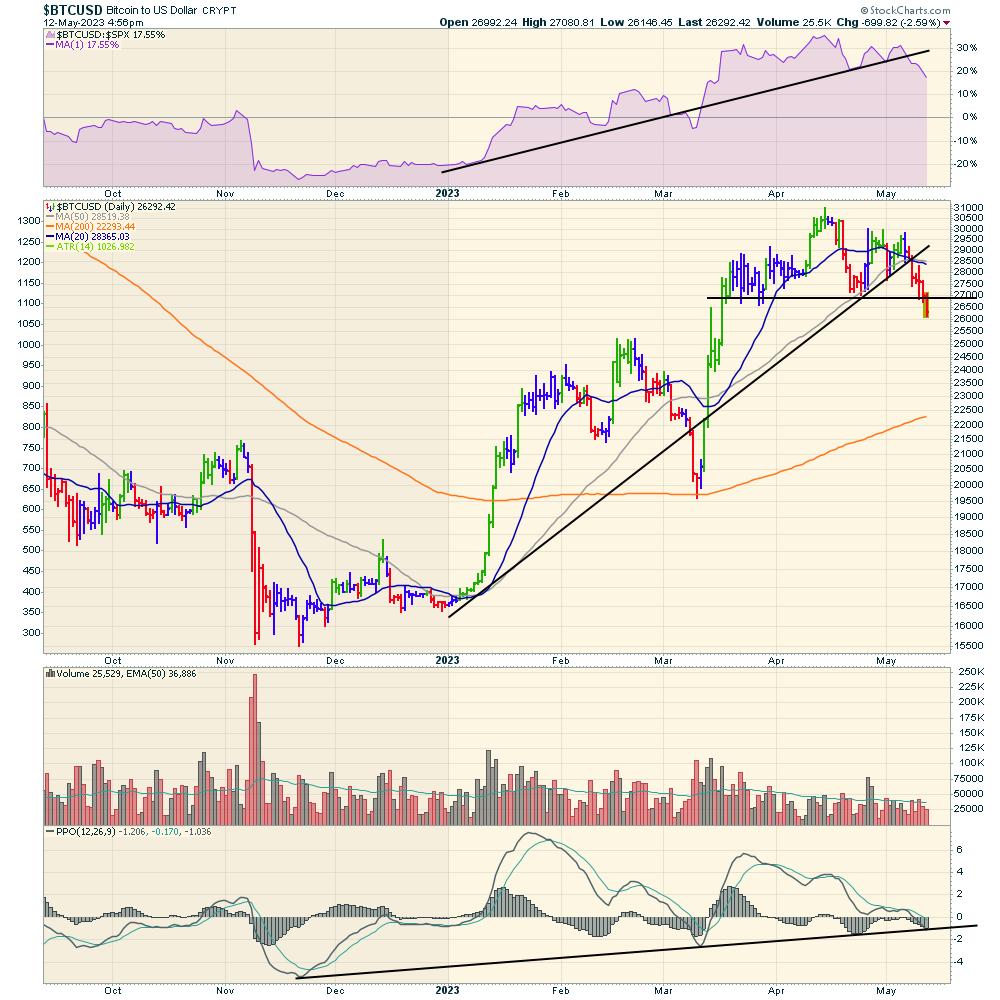
The volume has been declining since the January surge. So interest is waning a little. Lastly, the PPO has a series of rising lows. Right now, the PPO is pointed down and may break that trend.
When we look at the weekly chart, the trend is a little different. First of all, there is a double off the November lows to this rally. That's awesome! Technically, there are some other signals kicking in.
The relative strength in purple is breaking for the first time since November. The Elder candle has turned red for the first time since the November rally started. Volume is declining, and the Full Stochastic has rolled over on a sell signal. PPO is still above the signal line, but starting to slow its advance.
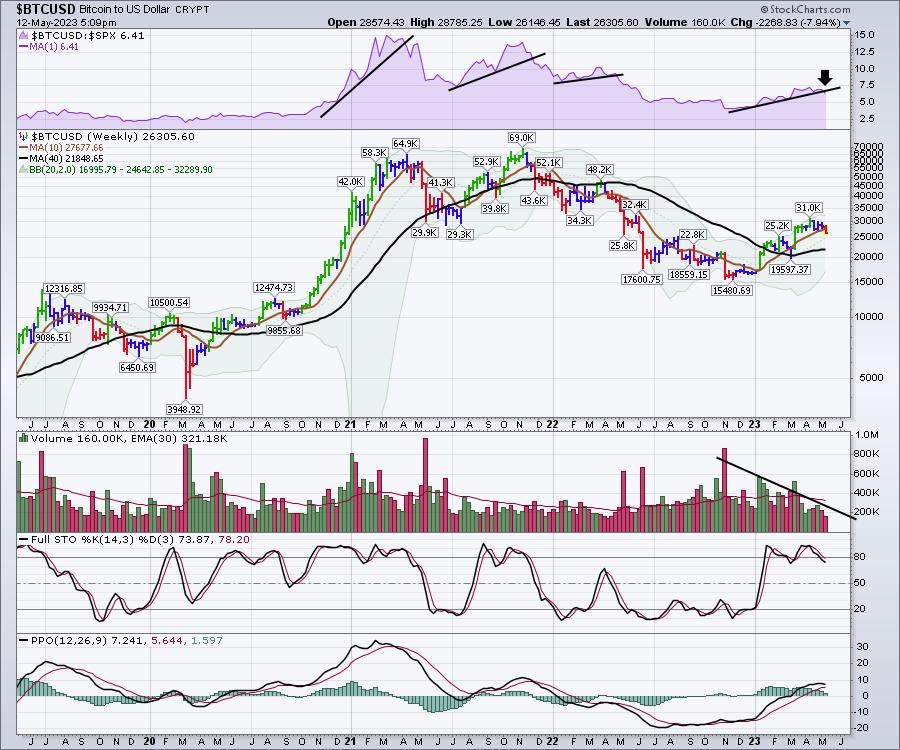
Will Bitcoin go to $100,000? It might, but right now the chart is weakening. If we look left on the weekly chart, how important was $30,000 for support? Now it has become resistance. For technicians, it is not a surprise that Bitcoin stalled trying to get through $30000 as what was support becomes resistance. Now there will be fib retracements and 'hold on for dear life -HODL' investing styles coming out of the Twitter world endlessly. But the most important thing to recognize is that the chart currently looks like a base needs to form and it might be wise to respect the price action until it does. Not predicting doom and gloom; just suggesting to respect the current price action.
Greg will be presenting at the Moneyshow on Wednesday May 17 at 3:20 PM ET. You can follow this link to register! Thanks in advance for your interest!

Good trading,
Greg Schnell, CMT, MFTA
Senior Technical Analyst, StockCharts.com
Author, Stock Charts For Dummies
Want to stay on top of the market's latest intermarket signals?
– Follow @SchnellInvestor on Twitter
– Connect with Greg on LinkedIn
– Subscribe to The Canadian Technician
– Email at info@gregschnell.com
