Homebuilders have been on an unbelievably big run. Looking at two relevant ETFs, we can see that one is at prior highs, while the other broke out to fresh new highs. Let's start there.
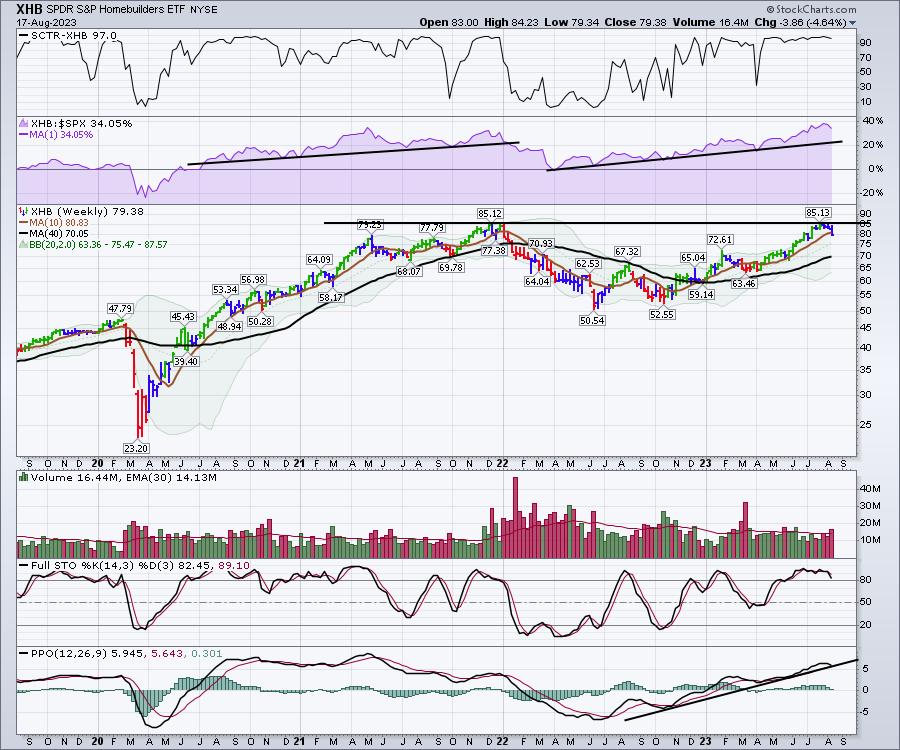
XHB was recently at a prior high, and the ITB made newer highs. Amazingly, XHB -- the homebuilders ETF -- got within 0.01 cent of the prior high, then pulled back below the 10-week moving average on Thursday. Everything is still in an uptrend! The only real sign of weakness is the potential for a sell signal on the PPO.
- The SCTR is still at 97.0, which is very strong.
- Relative strength compared to the $SPX is in purple, and is still near the highs. If it started to break the trend line from early April, that would be another signal of weakness.
- Price stalled at the prior high.
- Volume has been strong. This is after Thursday's move, and Friday's volume will be an Options Expiration, so it could have a big volume bar to finish the week.
- Full stochastic shows price still trading in the top of the range for the last 3 months of the year, so no real new news there.
- PPO is trying to hold on the uptrend, but will be very close to a sell signal.
That's a pretty strong basket of signals.
ITB, the home construction ETF, looks a little different this week. Namely, this is the first red week on the price panel since the lows of last October! Price is still holding on the trend line, but the red bar is a warning.
All of the other trends recorded on the chart above are intact, with one exception: the PPO is already on a sell signal.
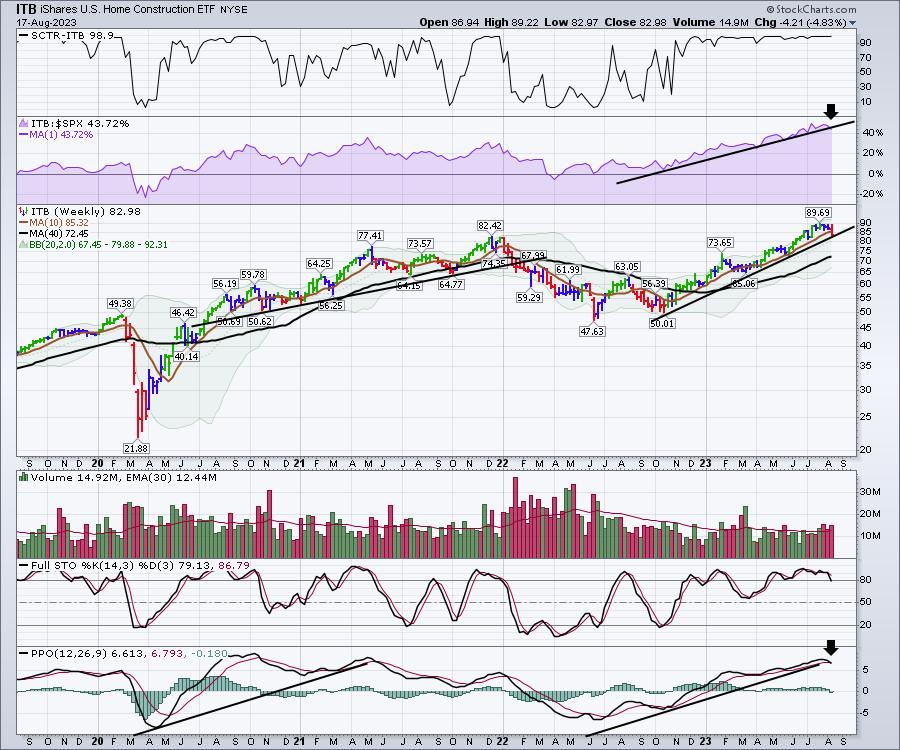
The real question to ask for me is whether or not this is the end of this big trend. I don't know if it is or not, but all the trends are being tested. It's a good time to be careful, in case it starts to break down.
Good trading,
Greg Schnell, CMT, MFTA
Senior Technical Analyst, StockCharts.com
Author, Stock Charts For Dummies
Want to stay on top of the market's latest intermarket signals?
– Follow @SchnellInvestor on Twitter
– Connect with Greg on LinkedIn
– Subscribe to The Canadian Technician
– Email at info@gregschnell.com


