Over the last few weeks, metals have been swinging wildly. I have been following Copper and Gold, and it has been a wild ride, to say the least. I'll cover off Copper and related miners today. As we wait for the world of electric cars to consume every ounce of copper, the focus for copper mining and production remains high as inventories remain low.
One of the metal mining ETFs is CPER, which trades like copper. It broke out to a higher high in mid-July, continuing a series of higher lows and highs, only to gap back down on Monday, July 17th. After a sideways week, copper surged on July 25th and tested the prior highs. In a choppy week, copper darted around but closed near the highs. On Monday, July 31, Copper surged higher with a clear break above resistance. By Wednesday, all sense of a new high was gone and copper was back below the 100-MA.
There is a trend of rising highs and rising lows. The volume has been improving, but the volume this week was well outside the June period. With the PPO rolling over onto a sell signal to end the week, it's an awfully hard trade to hold.
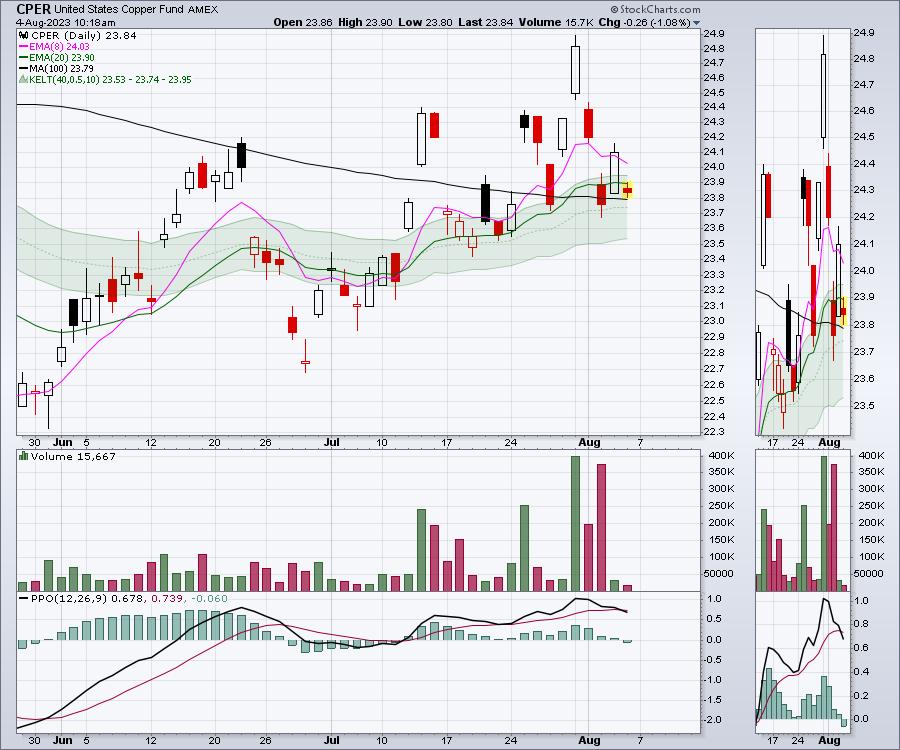
The hard part is copper is making higher highs and higher lows, but every day is a sudden move that's either supportive or damaging, making it hard to hold. While many investors might not own copper directly, some copper miners have been a robust trade, making higher highs.
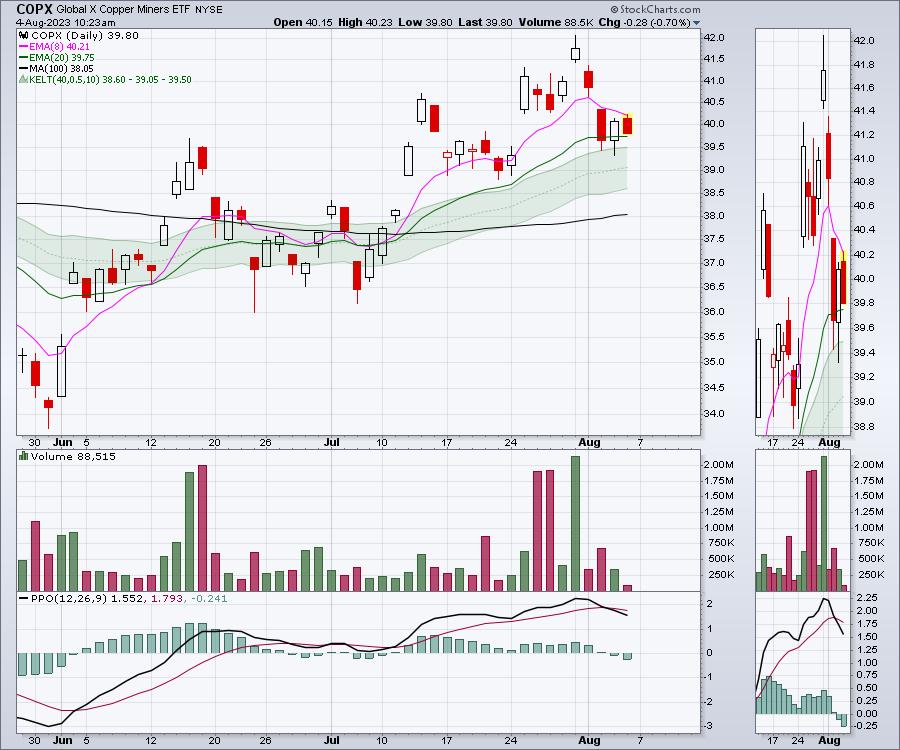
The chart below is COPX, which is the copper miners ETF. Clearly, a case can be made for higher highs and higher lows. The difficult part is the opening gaps up and down every day. The high volume bars seem to be indicative of short-term tops. Now that the COPX ETF is back on a sell signal on the PPO, is it worth holding the metals throughout the third quarter?
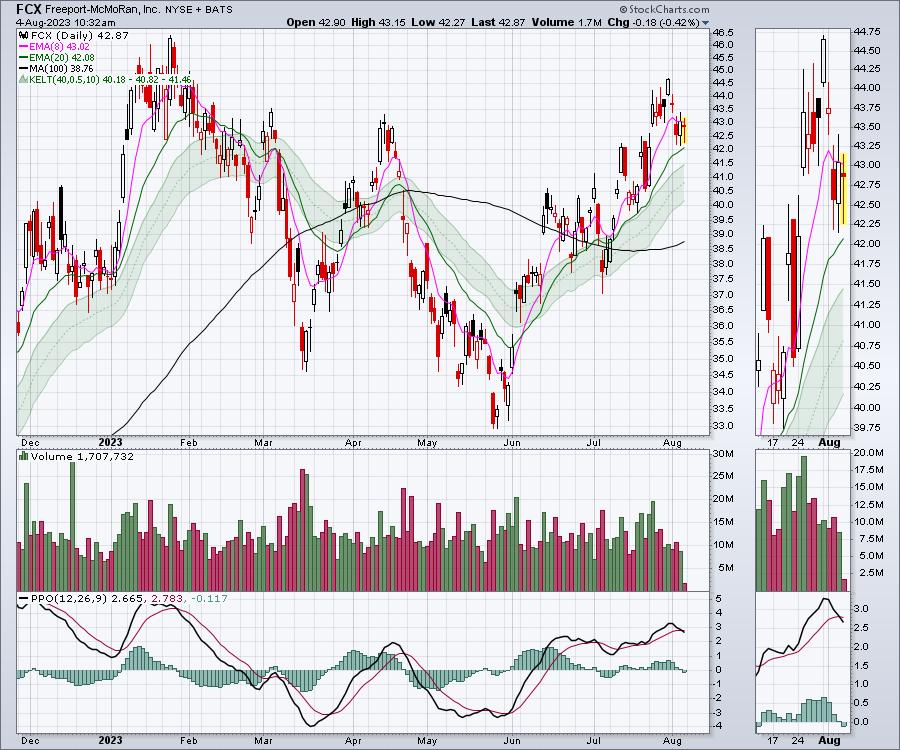
When I look at names like Freeport-McMoran (FCX) and Southern Copper (SCCO), their charts look good. The FCX chart has been pushing higher since June 1 through to July 31, but the PPO is rolling over onto a sell signal again. Which way will price go now?
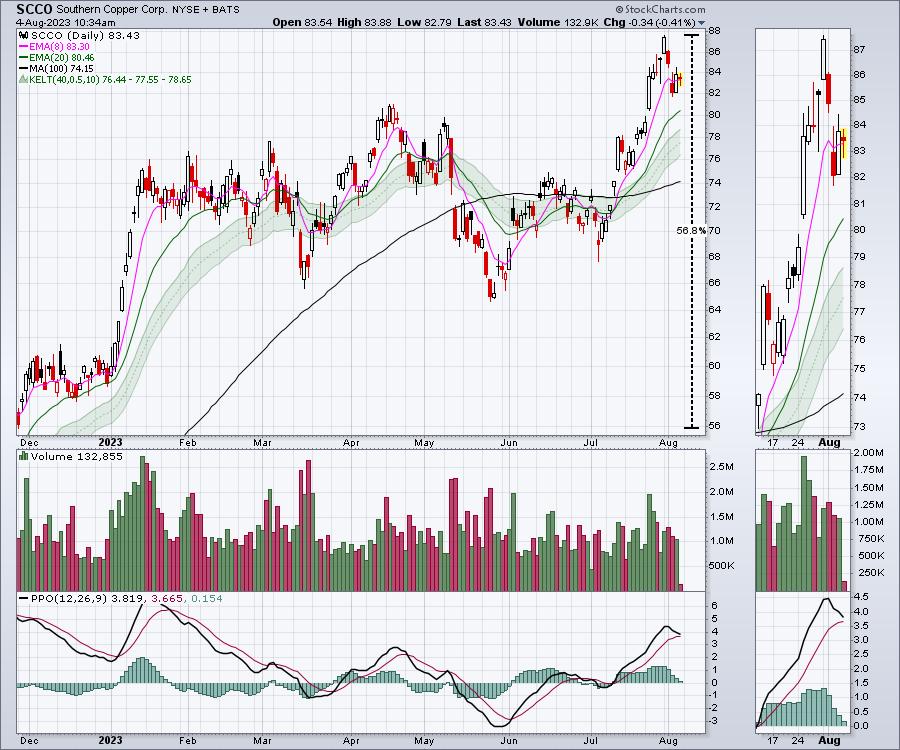
Looking at SCCO, this chart is even nicer. The stock is up 56% from late November 2022 and broke out to new 52-week highs last week! However, the PPO looks like it is ready for a sell signal.
 The bottom line is that the copper stocks have been hard to hold and, with the indexes starting to retrace, the best gains in copper names might be behind us for a few months. It is so frustrating, as the stocks are just starting to make higher highs, but then rolled over in earnest to start August.
Good trading,
Greg Schnell, CMT, MFTA
Senior Technical Analyst, StockCharts.com
Author, Stock Charts For Dummies
Want to stay on top of the market's latest intermarket signals?
– Follow @SchnellInvestor on Twitter
– Connect with Greg on LinkedIn
– Subscribe to The Canadian Technician
– Email at info@gregschnell.com


