The current market pull-back is getting serious. Check out the current Nasdaq chart:
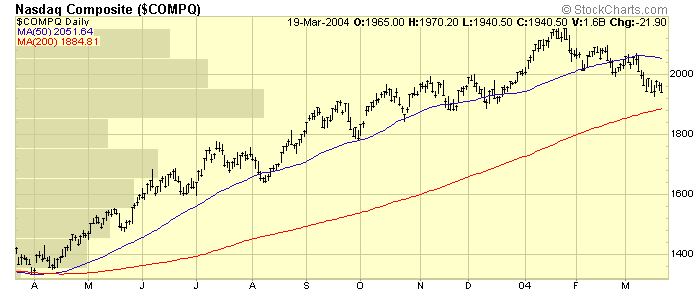
See the long "Price-by-Volume" bar sticking out from the left side of the chart around the 1900 level? That represents the largest support level for the Nasdaq during the course of the past 12 months. If prices were to move below 1875, there's not much near-term historical support left. Staying above 1900 is very important for the index right now.
Our other newsletter contributors have more on the current state of the market below, but first I want to look at the newest indicator we've added to our site - the Money Flow Index.
THE MONEY FLOW INDEX
Since the site first got started, we've provided everyone with one of my favorite indicators, the Chaikin Money Flow (CMF). A variation of the Accumulation/Distribution line, the CMF combines price and volume movements into a single indicator that can be used to verify signals generated by other "price-only" indicators like the RSI and the MACD.
While the CMF continues to serve us well, we've just added its close cousin, the Money Flow Index in the new Beta release of our SharpCharts2 charting engine. The Money Flow Index (MFI) is a bounded oscillator that ranges between zero and 100 with an "overbought" level at 80, an "oversold" level at 20, and a center line at 50. Whereas the CMF uses the position of the close relative to the mid-point of each day's bar, the MFI uses the average of each day's high, low, and closing price to determine if money is "flowing" into or out of the stock.
In many ways, the MFI is less sophisticated than the CMF and that simplicity can result in premature signals. Consider the following chart:
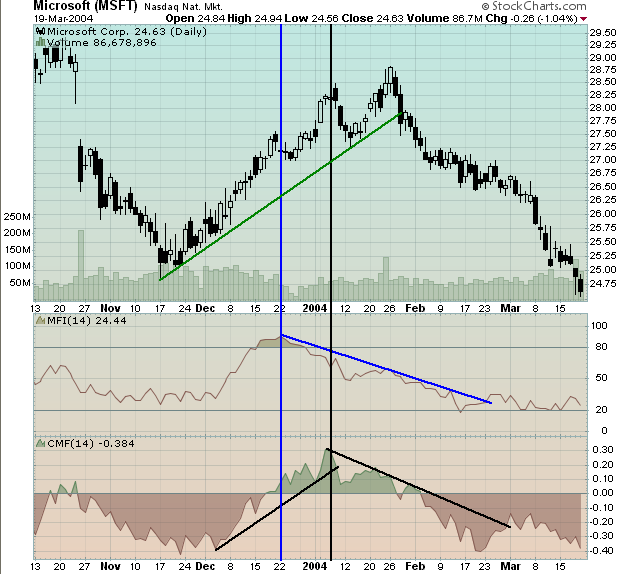
Notice that the MFI topped out on 22-Dec (blue vertical line) whereas the CMF waited until the first week of January before turning lower for good (black vertical line). Of course, this suggests an extremely valuable use for the MFI - as a confirmation indicator for the CMF. Savvy chartwatchers would have noticed the developing divergence between the MFI and the CMF during the final weeks of 2003 and would have become more cautious about their MSFT positions.
As with all of our charting tools, I urge you to start using and experimenting with the MFI and see if it can help your investing track record. Remember that, for now, only our Beta edition of SharpCharts2 has the MFI (and TRIX) indicators. To get started, click here.


