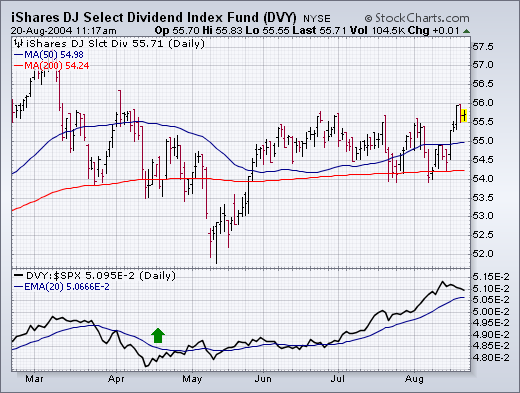
GOING FOR DIVIDENDS... A falling stock market -- along with falling bond yields -- should make dividend paying stocks more attractive. And that appears to be the case. Chart 1 plots the iShares Dow Jones Select Dividend Index Fund (DVY), which invests in large cap stocks that pay dividends. The Dividend ETF has acted much better than the rest of the market since last April as reflected in its rising relative strength line. Pricewise, the ETF hit a new four-month high earlier in the week. The two groups most heavily represented in the Dividend Fund are banks (38%) and electric utilities (19%). Other holdings include (in order of size) chemicals, tobacco, insurance, fixed line communications, and energy.
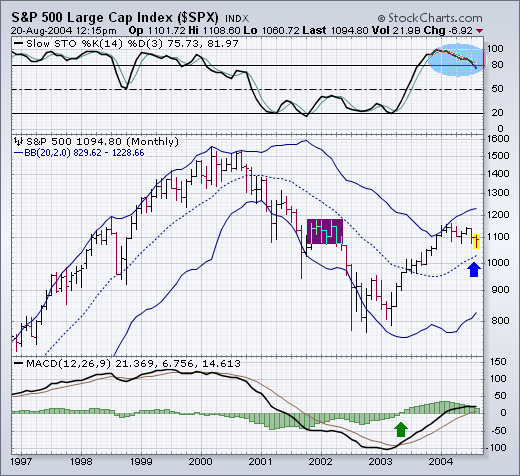
S&P MONTHLY BARS OVERBOUGHT BUT STILL IN LONG-TERM UPTREND... The monthly bars in Chart 2 carry good and bad news for the S&P 500. First the bad news. The monthly stochastic lines above the chart are still weakening from overbought territory above 80 (see circle). In addition, the price bars show that the S&P bull trend stopped at its early 2002 peak (see box) -- after recovering half of the 2000-2002 losses. The good news is that the S&P remains above its (dotted) 20-month moving average (see arrow) which qualifies the current price drop as a correction as opposed to a bear market. And, finally, the monthly MACD lines which turned positive at the start of 2003 (see arrow) are still positive.


