For an idea of how a FUTURE trend reversal might look, traders may wish to focus on the August low and think inverted.
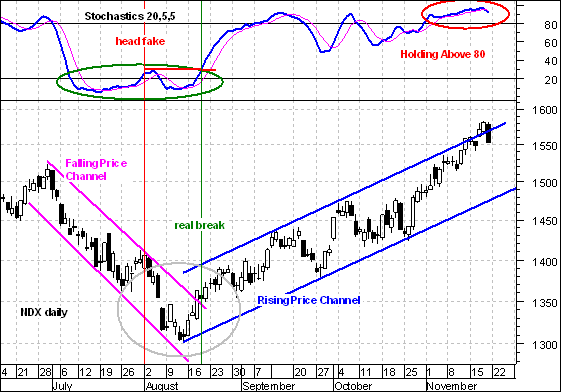
The July-August downtrend was defined by a falling price channel and a Stochastic Oscillator below 20. Notice that the Stochastic Oscillator moved above 20 for a few days and then fell back (~ 1-Aug). This first attempt failed as both the indicator and index continued lower. The second Stochastic Oscillator break above 20 was accompanied by an index break above the upper trendline. In addition, the Stochastic Oscillator moved above its prior high. This signal stuck and the rest is history.
Looking at the current situation and applying recent inverted history, the first move below 80 could be a head fake and would likely occur with the index still above the lower trendline. The second move below 80 could be the one that is accompanied by a trendline break and the one that holds.
Why two moves? The advance over the last few weeks was quite strong and needs some time to unwind. Buying pressure is unlikely to dry up over night, just as selling pressure did not dry up after the July bounce. The first dip will entice buyers and this usually causes another run at resistance. It is the second decline that traders should watch. For now, the trend remains firmly bullish and this is just food for though on the future.