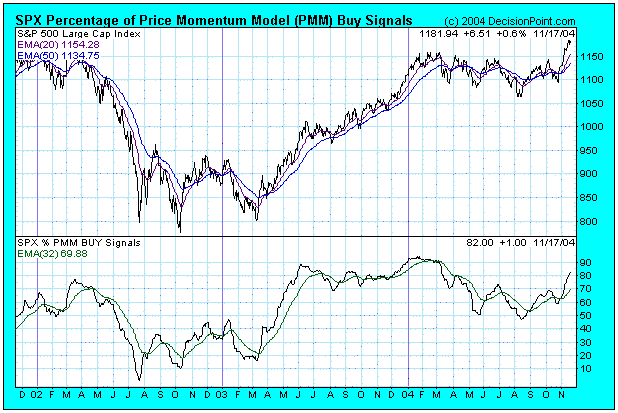
The market has finally broken out of the 2004 trading range, but many people are worried that the move could be a bull trap. One way to judge the authenticity of a move is to see how many stocks and/or sectors are participating in it. To do this we can look at the Percentage of PMM Buy Signals.
Decision Point's Price Momentum Model (PMM) generates longer-term buy and sell signals based strictly on price movement. (To learn more about the PMM click here ). We apply this model to all the stocks in a market index, then summarize the percentage of buy signals into an indicator.
We can see on this chart that the Percentage of PMM Buy Signals for stocks in the S&P 500 Index is currently above 80%, which means that participation in this rally is quite broad, and that smaller-cap stocks in the index are participating as well as the large-cap stocks.
While a reading above 80% is good in terms of participation, it is also a level that we would consider to be overbought. This may or may not be a problem. In a bull market, conditions can remain overbought for extended periods of time, and prices can continue to move higher in spite of it. The last half of 2003 is a good example of this.
There is no practical way to guess how long this rally may last, but you will notice that the indicator was not seriously oversold when the rally began. The first leg of the bull market began when the indicator showed less than 20% PMM Buy Signals, whereas there were slightly less than 50% of PMM Buy Signals at the start of this rally. I interpret this to mean that, because the market was not seriously oversold at the start, this rally is not likely to last as long as the one in 2003.


