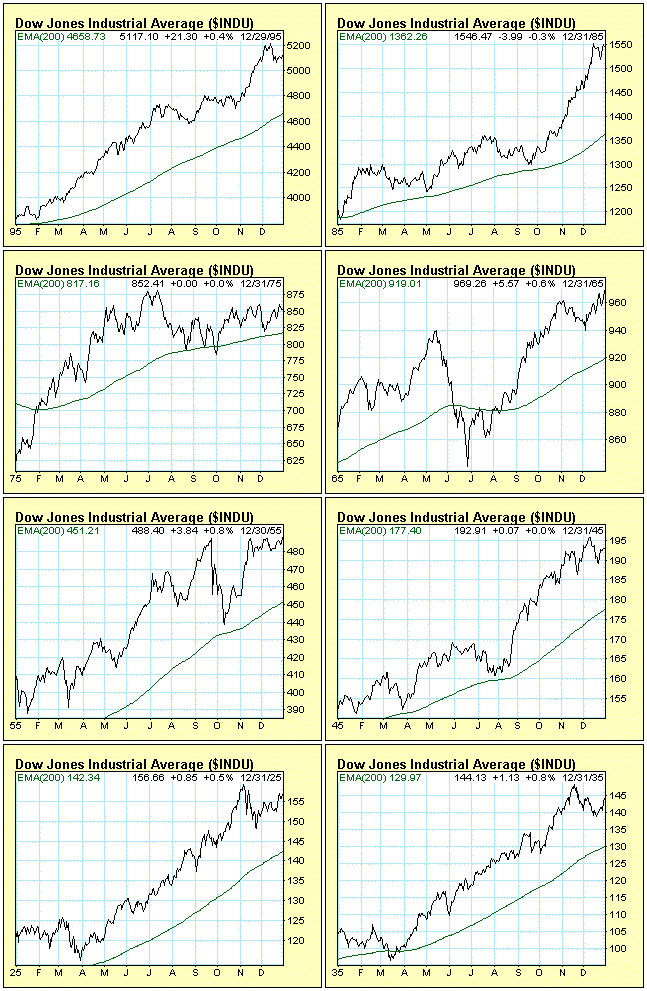
The Decennial Pattern refers to the fact that years ending in the number five (5) are up years for the stock market. This is not just a statistical tendency. In fact, this has been the case for every year ending in 5 since 1885. Furthermore, the price low for these years has been made in the first quarter of every year except 1965. Many find this evidence quite compelling, however, John Hussman (hussman.com) demonstrates in his 1/24/2005 weekly commentary why the decennial pattern is "statistically unimpressive." Nevertheless, there could be more to this pattern than luck and serendipity. Years ending in 5 are also either the first or third years of a presidential term, and these tend to be up years.
While the Decennial Pattern is a bullish sign for 2005, I wouldn't bet the ranch on it. Every year has it's own character, and it is better to follow the trend and remember that getting heads 100 consecutive times flipping a coin, the odds of getting heads on the next toss are still 50-50.
Below are charts of the last eight years ending in 5 (that's as far back as we have data). Our thanks also to Peter Eliades (stockmarketcycles.com) and Tom McClellan (mcosillator.com) for the research used in this article.

