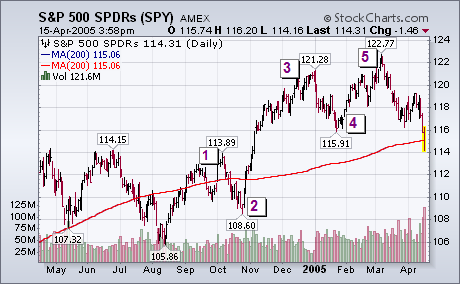
After this week's breakdown, there can be little doubt that the cyclical bull market that started in October 2002 has ended. The question now is how far down can the market drop. The daily bars in the chart below show the S&P 500 SPDR breaking its January low and closing beneath its 200-day moving average. Downside volume was very heavy. There's a support level at 108.60 at its late October low. But I think the S&P (and the other major stock averages) are headed all the way back to its August low. That's based partially on standard chart analysis, and partially on Elliott Wave Theory. The chart shows that the rally off the August low took place in five waves. The breaking of the bottom of wave 4 (the January low) confirmed that the rally ended. But there's another Wave 4 to consider.