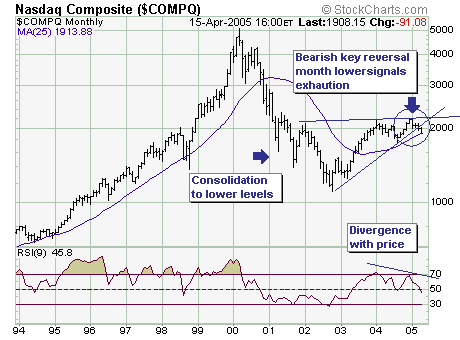
From Tuesday's close last week; the Nasdaq Composite ($COMPQ) has declined in mini-crash' fashion: down -4.8%. The question is whether there are further declines ahead or whether a sustainable rally will develop back towards the highs or even new highs. An instructive chart to this end is the monthly chart; which shows a major bearish consolidation after the 2000-2002 declines. In fact, trendline support was recently violated, with the next to last support' to be tested being the major 25-month moving average the other being the 2004 low.
Friday's trade broke below this moving average by 5 points; any further deterioration would certainly not suggest higher future prices. We very well may see this level hold given short-term oversold conditions, a countertrend rally develops and then a later date moving average failure. Or, this level holds and prices turn higher on a multi-month crusade. All are plausible outcomes, although we accord a higher probability to the first two.
Thus, a fulcrum point is at hand, which increases whipsaw risk but it will also solidify our questions about the next larger move in either direction. In our opinion, one simply should use rallies to put on short positions in the proper technology sectors/industries.