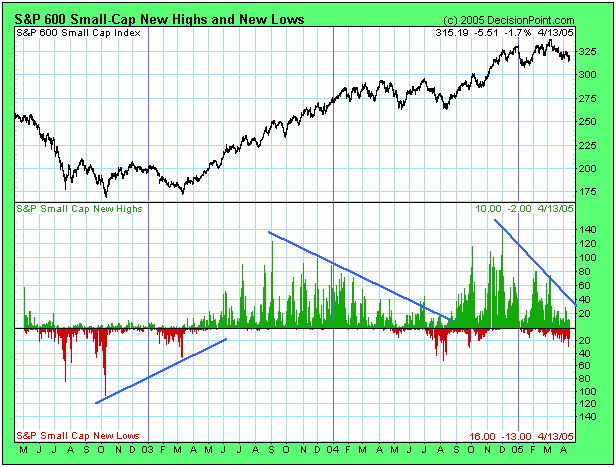
At DecisionPoint.com we have recently added a chart of S&P 600 Small-Cap 52-week new highs and new lows (NHNL). (We also have NHNL charts of the S&P 500, S&P 400 Mid-Cap, NYSE, and Nasdaq). This allows us to examine and determine the condition of each sector.
As with other indicators, we look for divergences between the indicator and prices. New lows are particularly good for identifying long-term bottoms. Note the sharp contraction of new lows in March 2003 compared to October 2002 associated with price lows that were about the same. This positive divergence was a good sign that the bear market decline was ending.
From March 2003 new highs began to expand until they peaked in September 2003. From there they began to contract and continued to do so for almost a year. So why didn't this negative divergence signal a major price top? Primarily because in a bull market negative divergences are very unreliable.
One way we can determine if a contraction of new highs is probably meaningless is by observing what is going on with new lows. Note how between September 2003 and August 2004 there was virtually no expansion of new lows until the end of the period when the bull market correction climaxed.
Next we can see how new highs peaked in December 2004, and they have been contracting ever since. This time we can see that the angle of contraction is much steeper than the previous one, and, more important, there is a visible and persistent expansion of new lows. The negative divergence of new highs along with the expansion of new lows is one sign that the bull market may be over.

