ChartWatchers June 18, 2005 at 10:05 PM
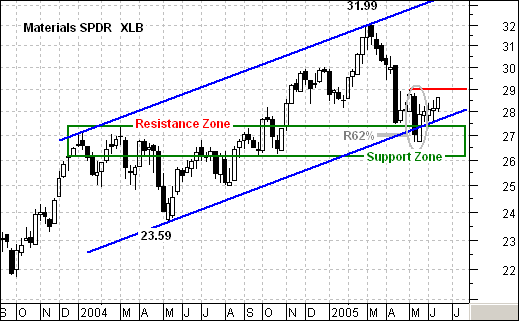
The Materials sector was all the rage in 2004, but fell on hard times in 2005. After a run from 23.59 to 31.99 (35%), the Materials SPDR (XLB) declined below 27 with a sharp decline... Read More
ChartWatchers June 18, 2005 at 10:04 PM
While persistently rising prices are frustrating the bears and encouraging the bulls, there is evidence that distribution is taking place... Read More
ChartWatchers June 18, 2005 at 10:03 PM
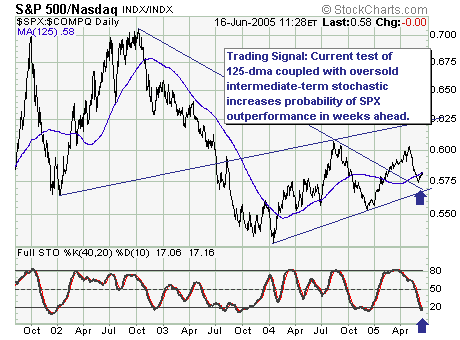
The recent S&P 500 price action above the 1190 level is rather impressive, and can be considered a correction in 'time' rather than in price. This suggests new highs; however, those highs aren't expected to be accompanied by new highs in the Nasdaq Composite... Read More
ChartWatchers June 18, 2005 at 10:02 PM
Unexpected Returns by Ed Easterling A great book amplifying the merits of absolute return investing vs. relative return investing so often touted by Wall Street. New Trading Systems and Methods by Perry Kaufman This is the latest and biggest in this technical analysis classic... Read More
ChartWatchers June 18, 2005 at 10:01 PM
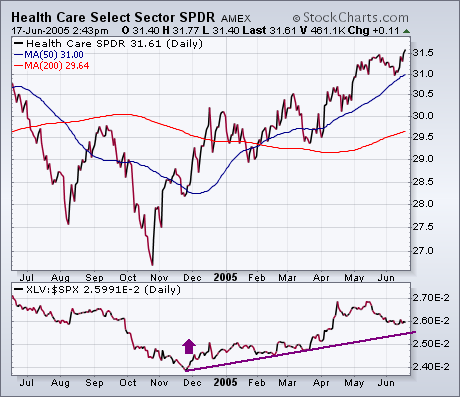
While a lot of attention has been paid to rising energy and basic material stocks this week, not much has been written about healthcare. It's time to correct that. Chart 1 shows the Health Care Sector SPDR (XLV) closing the week at a new 52-week high... Read More
ChartWatchers June 18, 2005 at 10:00 PM
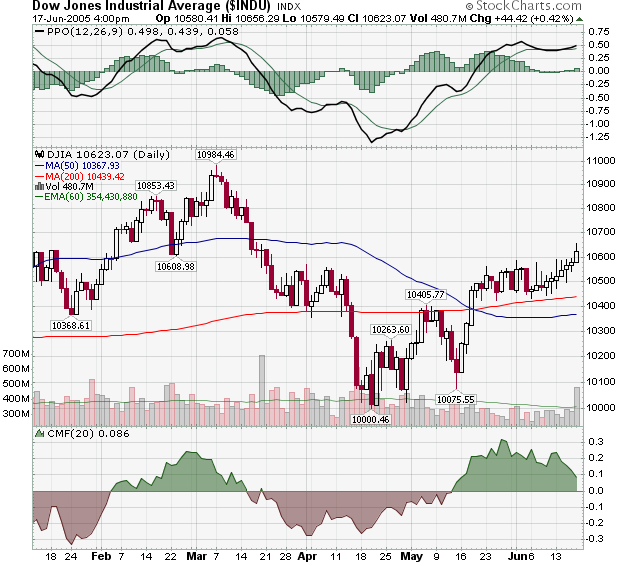
Seven straight days of gains has moved the Dow back above the 10,600 level - something that looks even more impressive given Friday's significant volume increase. Next week should see a test of 10,600 as the index tries to consolidate its gains... Read More
ChartWatchers June 04, 2005 at 10:05 PM
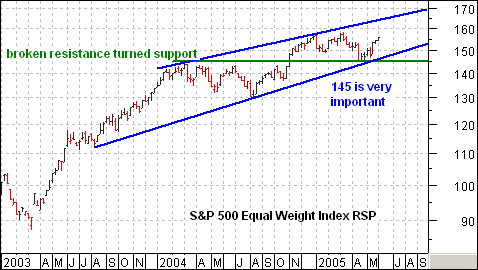
As its name implies, the Rydex Equal Weight S&P 500 Index (RSP) treats all component equal, regardless of market capitalization. This means that ExxonMobile (XOM). with market cap of $369 billion, counts the same as Teco Energy TE), which has a market cap of just $3.64 billion... Read More
ChartWatchers June 04, 2005 at 10:04 PM
Decision Point tracks actual cash flowing into and out of Rydex mutual funds, and, while cash flow normally runs parallel to price, divergences can often appear ahead of price reversals. For example, let's look at Rydex Energy and Rydex Energy Service Funds... Read More
ChartWatchers June 04, 2005 at 10:03 PM
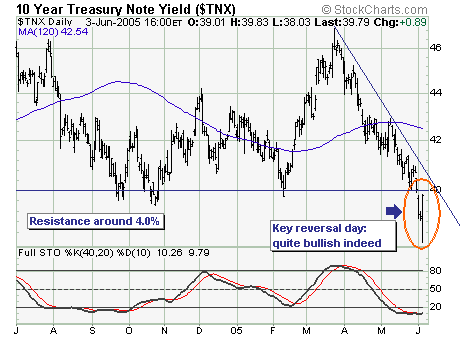
Rarely do they ring a 'bell' at the bottom, but Friday's reversal higher in bond yields argues strongly for a sustained move higher in interest rates... Read More
ChartWatchers June 04, 2005 at 10:02 PM
- We took a big step forwards last week behind-the-scenes with our SharpCharts2 Beta program... Read More
ChartWatchers June 04, 2005 at 10:01 PM
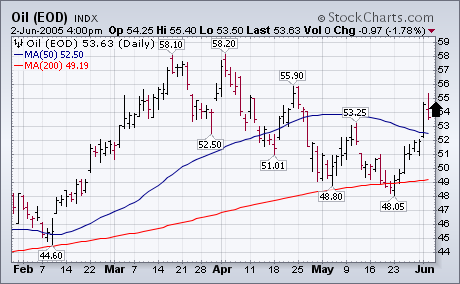
... A lot of recent optimism on the stock market and the economy has been predicated on the view that the historic rise in oil prices has probably ended. A lot of economists have also declared the major bull market in commodities over... Read More
ChartWatchers June 04, 2005 at 10:00 PM
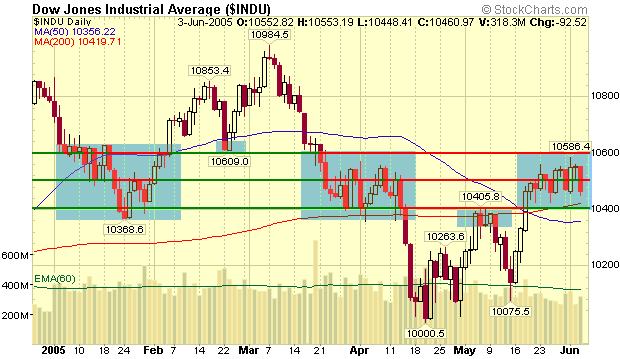
This week saw the markets move "violently sideways" as large up-days were immediately followed by similarly large down-days. Essentially, the Dow is continuing to lurch around inside of its 10,400 to 10,600 trading range... Read More