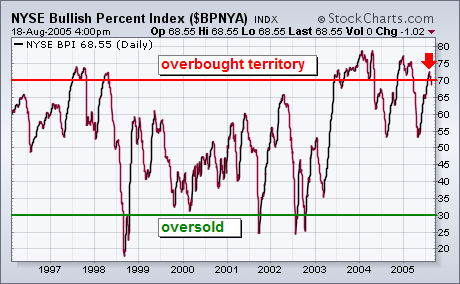
One of the ways to determine if the stock market is in a long-term overbought or oversold area is to chart the NYSE Bullish Percent Index which is shown in the chart below. The BPNYA measures the percent of stocks that are on point & figure buy signals. The two key numbers on the chart are 30 and 70. Readings under 30 show the market in a major oversold condition. Readings over 70 show a major overbought condition. The chart shows that the index traded over 70 three times since the start of 2004. A more dangerous signal is given when the line drops back under 70. That's a sign that the overbought market is starting to weaken. I point this out because the BPNYA has just fallen back below 70 (see red arrow).

About the author:
Chip Anderson is the founder and president of StockCharts.com.
He founded the company after working as a Windows developer and corporate consultant at Microsoft from 1987 to 1997.
Since 1999, Chip has guided the growth and development of StockCharts.com into a trusted financial enterprise and highly-valued resource in the industry.
In this blog, Chip shares his tips and tricks on how to maximize the tools and resources available at StockCharts.com, and provides updates about new features or additions to the site.
Learn More


