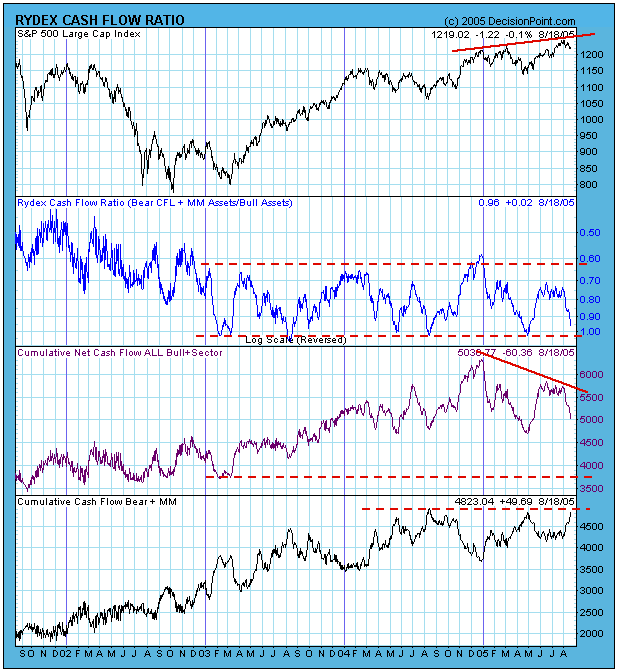
There is growing evidence that a bull market top is finally in place, but not all the evidence supports that scenario. For example, the Rydex Cash Flow Ratio shows that bearish sentiment is again approaching record levels, indicating that another run at new price highs could be in the cards.
Decision Point's Rydex Cash Flow Ratio differs from the Asset Ratio in that it is based upon a cumulative total of daily net cash flow for each of the Rydex mutual funds, not raw asset levels. The Cash Flow Ratio is calculated by dividing the total bear fund cash flow plus money market cash by the total bull and sector fund cash flow.
As you can see on the chart, the Ratio (first panel below the S&P 500 graph) has been in a trading range for nearly three years, and the bottom of that range has been a reliable measure of bearish excess sufficient to signal important price bottoms.
Once again the Ratio is approaching the bottom of the range, and bearish cash flow (bottom panel on the chart) is near record high levels. Moreover, this sharp increase in bearish sentiment has occurred with only a minor price decline -- people have gotten too bearish too fast. All this should send up warning flags to the short sellers.
Having said that, let me point out that it is entirely possible for prices to head lower and for bearish cash flow to punch through the resistance to new highs, causing the Ratio to break through the bottom of its range. Also, the failure of bullish cash flow to follow prices to new highs presents a serious negative divergence, indicating that participation has faded significantly.
Nevertheless, the most obvious thing I see on the chart is that sentiment has gotten bearish too quickly, and that is not good news for the bears.


