At the end of August, a very promising thing happened on the Dow Jones Industrials chart. Did you see it?
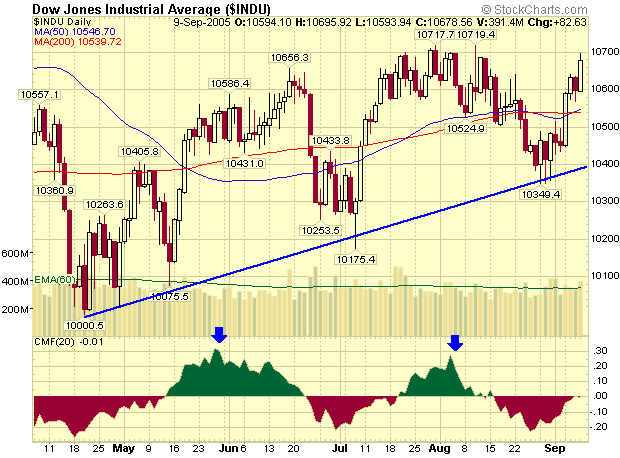
Last Thursday the index reversed around the 10,350 level. That confirmed the intermediate term uptrend (blue line) that goes back to the 10,000 low from last April. During this uptrend there have been two cycles between the three troughs - those peaks are clearly shown on the Chaikin Money Flow graph (blue arrows). If this pattern continues, expect to see the market rise until the CMF turns lower in a couple of weeks. But watch this chart closely folks! This week's test of 10,700 is key.

About the author:
Chip Anderson is the founder and president of StockCharts.com.
He founded the company after working as a Windows developer and corporate consultant at Microsoft from 1987 to 1997.
Since 1999, Chip has guided the growth and development of StockCharts.com into a trusted financial enterprise and highly-valued resource in the industry.
In this blog, Chip shares his tips and tricks on how to maximize the tools and resources available at StockCharts.com, and provides updates about new features or additions to the site.
Learn More


