The markets are getting very interesting these days! Last week saw some big declines that were mostly erased by Friday's rally.
If you're looking for bearish signals, look no further than our Dow Jones Industrials Index P&F chart:
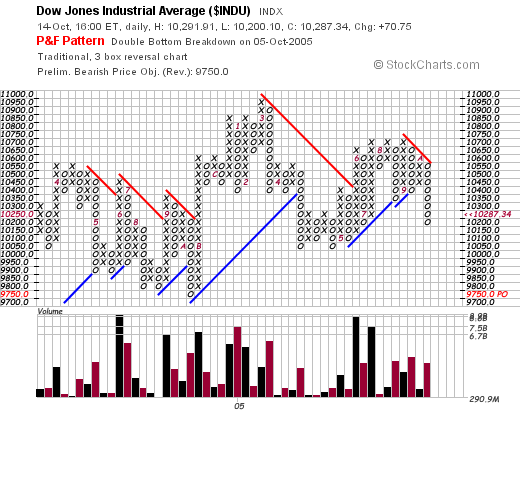
I draw your attention to the volume bars at the bottom of the chart. Note that the last three red volume bars are much higher than the last three black volume bars. That means that the market has been more active during the last three significant downtrends than it has during the intervening uptrends - a sure sign of growing market pessimism. In addition, the simple P&F price objective - based on the double-bottom breakdown signal from last week - is now at 9750. While I doubt that prices will get that low anytime soon, there's a good chance the major support level at 10,000 will be retested soon.
Our other authors are decidely bearish also. John looks at Bear funds, Carl calls this market "dangerous", Arthur thinks the Nasdaq's RSI is oversold, and Richard calls the S&P 500 "weak". Read on for all the details.
