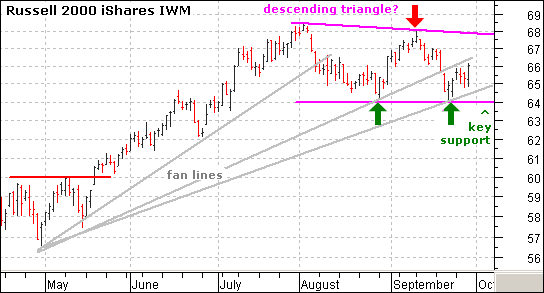
The Russell 2000 ETF (IWM) has two potentially bearish patterns working that would be confirmed with a support break at 64 (645 for the Russell 2000). Confirmation is the key with both patterns. In fact, confirmation is the key to most patterns. Until confirmation, these are only potentially bearish patterns and a trend reversal has yet to take place.
The descending triangle usually marks a continuation of a downtrend, but can also mark a top. The lower high (red arrow) shows that buyers do not have as much power as before and upside momentum is waning. However, the equal lows represent support and show that the sellers have yet to take full control (green arrows). A support break would signal a new thrust of selling pressure and confirm the bearish pattern. The downside projection would be to around 60 and broken resistance from the April-May highs confirms this level.
The second potentially bearish pattern involves three fan lines. These extend up from the April low and the stock already broke the first two. IWM has consolidated since breaking the second fan line and a move below the third would confirm this bearish setup. Notice that the third fan line and descending triangle lows confirm support around 64 and it is clear that a break below this level would be most bearish.
- Arthur Hill


