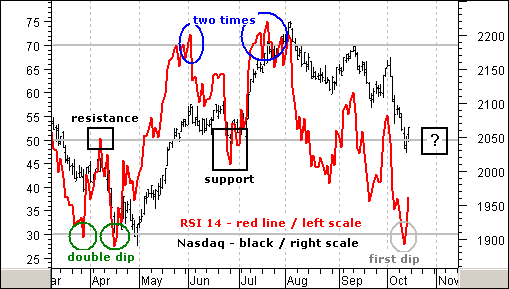
This week 14-day RSI for the Nasdaq became oversold (below 30) for the first time since April (gray oval). Even though securities can become oversold and remain oversold, the odds of a bounce increase with oversold conditions. The question is not whether there will be a bounce or not, but rather how far will the bounce extend and when will the bounce end.
Previous extremes in RSI occurred in pairs with an intermittent move to around 50. Notice that there were two oversold dips in March and April (green circles). The last overbought reading also featured two moves before the Nasdaq peaked in July (blue circles). The first overbought (oversold) reading serves as a warning to prepare for a pullback (bounce).
RSI usually finds resistance at 50 on an oversold bounce and support around 50 on an overbought pullback (black boxes). It is these moves to around 50 that provide a second chance to partake in the ongoing trend. To partake in this downtrend, I would wait for a bounce back to 50 in RSI and possibly 2100 in the Nasdaq, which marks broken support.