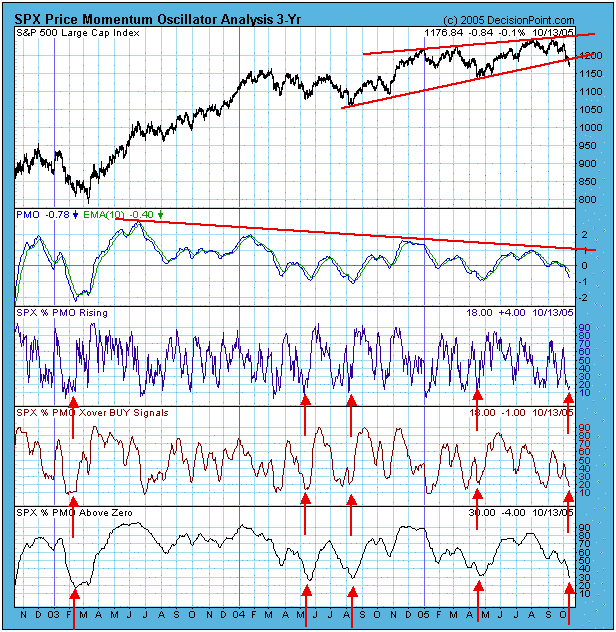
The Price Momentum Oscillator (PMO) is an expression of internal strength for a given price index. In the chart above we summarize three important PMO characteristics for the individual stocks in the S&P 500 -- the percentage of PMOs rising (very short-term), the percentage of PMOs on crossover buy signals (short-term), and the percentage of PMOs above the zero line (medium-term). The chart tells us that the S&P 500 is technically oversold in all three time frames. (To read more about the PMO click here).
We normally think of oversold conditions as signalling the next buying opportunity, and as you can see, oversold conditions such as this normally lead to some kind of rally once a price low is in place. Normally, but not always. During a bear market, oversold conditions can result in even more selling.
I don't know if that will happen this time -- I can't say with certainty that a bear market has begun -- however, there are good reasons for extra caution. Most obvious on the chart is the breakdown from the ascending wedge pattern, which is bearish. And spanning a much longer time frame is the declining tops pattern on the PMO, which diverges from the rising tops of the bull market.
Looking beyond the chart, we know that bull markets do not go on forever, and this one is three years old. Based upon my cycle work, the 4-Year cycle is due to crest, leading to a bear market decline that should last until about this time next year. Also, we have sell signals on all but two the 17 major market and sector indexes tracked by our primary timing model. The exceptions are Energy and Utilities, but they are under pressure as well.
Bottom Line: A bounce is likely, but I do not believe it will lead to new price highs. Rather, it will work off the oversold condition and set things up for a continuation of the decline. Worst case is that there will be no bounce, just more selling, and the market will become even more oversold. In either case, it is a dangerous time to be making bullish assumptions.


