Taking a long-term gander at the Nasdaq Composite, I think is very clear that the time is running out for prices to rise much further than they have at present. The reason is that prices are winding their way through the "triangle consolidation"; which means two scenarios exist – a bearish and bullish one to be exact. The bearish probability is highest in my mind with prices breaking down through trendline support and then the 25-month moving average currently at 2009 – thereby ‘confirming' a bear market has begun; or the lower probability breakout above major resistance at 2185-2200 – this would signal a new and larger leg higher is underway.
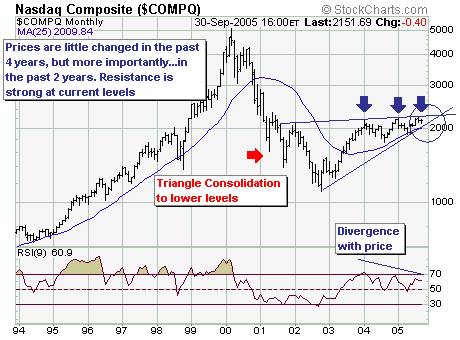
Given our stance is clear, it is so only because our longer-term models show the current rally's 'strength' has moderated significantly to where selling pressure is rising a sharp rate than in previous months. However, our shorter-term models are turning higher - which against the backdrop of our longer-term high probability scenario suggests a rally in the next several weeks that will be a 'final and material test' of the highs will occur and then fail with lower prices back towards 1200-1500 anticipated.
But the real cruxes of the situation will which themes to be involved in.
Performance
ETF Portfolio: +7.0%
"Paid-to-Play" Portfolio: +14.3%
- Richard Rhodes
