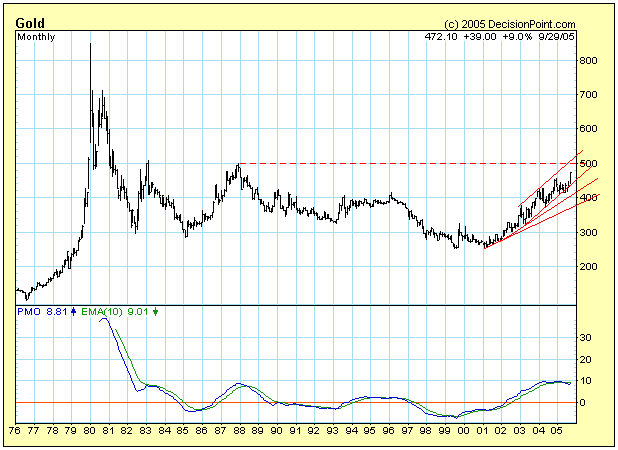
This chart of gold has some interesting technical features. First, there is the parabolic rise to $850 in 1980, which culminated in the inevitable blowoff and collapse.
After a parabolic collapse, prices most often return to the original base, which in the case of gold is somewhere below $100 and not visible on the chart; however, another outcome is that prices can enter a high-level consolidation, which is a trading range at a level far above the previous base, and this is what has happened with gold. In this case, the trading range is between roughly $300 ($250 at the extreme) and $500, and it serves the purpose of digesting the excesses of the parabolic, and preparing for the next long-term move, which I assume will be up.
The reason I assume that the next long-term trend will be up is because the double bottom in 1999 and 2001 marks the end of a 22-year bear market in gold, and a new bull market is in force. The problem is that the bull market is now nearly five years old, and we can clearly see overhead resistance in the area of $500, created by the intersection of the top of the rising trend channel and the top of the long-term trading range.
The normal technical outcome from a high-level consolidation is an upside breakout. We don't know if the current rising trend will be able to effect such a breakout, but sufficient time has passed that it would not be overly optimistic to have this expectation; however, remember, we are looking at a monthly chart (each bar is one month), and it could be another year or more before a breakout is made and confirmed.
For example, there were corrections within the rising trend channel in 2004 and 2005 that took several months to complete, so it is reasonable to expect that another lengthy correction will take place once the resistance around $500 is encountered.
Finally, let's look at the Price Momentum Oscillator (PMO). The PMO peak in 1980 is abnormally high and cannot be used as a benchmark for anything except another parabolic rise. The PMO's current level is typical for the trading range, but it is pretty high. This level could be exceeded if the rising trend continues and accelerates, but, if gold's current rate of climb is maintained, the PMO can remain flat, and, therefore, not much help in warning of a trend change.
Bottom Line: My long-term view for gold is positive, but I expect that, when it encounters the resistance at the $500 level, there will be a correction of sufficient length and depth ($450?) to consolidate the gains of the last five years and to move the PMO back toward the zero line.
- Carl Swenlin


