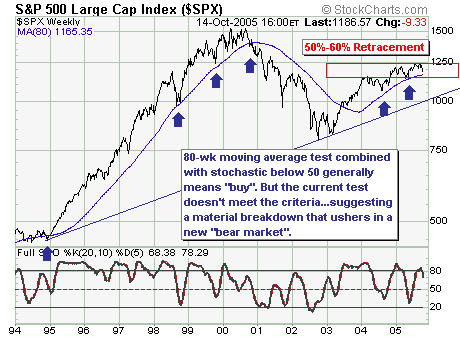
Today, the simple technical picture is breaking down in our opinion. If we look back to 1994, we find the 80-week moving average has been an excellent swing trading tool as it holds the data as near perfect as can be expected. Our concern focuses upon the current decline from the normal 50%-60% retracement level back to the 80-week moving average. Normally, we would be buyers of its test for a move to higher highs, but given the 20-week stochastic isn't below 50 - thereby confirming at least modest technical neutrality - this indicates that prices have still lower to work. Therefore, a breakdown below the 80-week moving average would signal the countertrend rally off the 2002 lows is complete, and an overweight and aggressive short campaign to "short the rallies" should be undertaken. We don't make these claims likely, but the probability suggests further S&P 500 weakness ahead.
2005 Performance
ETF Portfolio: +9.1%
"Paid-to-Play" Portfolio: +19.2%


