The Russell 2000 has not been the strongest broad index over the last few weeks, but it is still by far the strongest index in 2006 and shows no signs of stopping after another falling flag breakout on Thursday. This is the third such breakout since December and the death of small-caps has been greatly exaggerated. Longer term, the index remains in a rising price channel with lower trendline support at 755 and upper trendline resistance around 820.
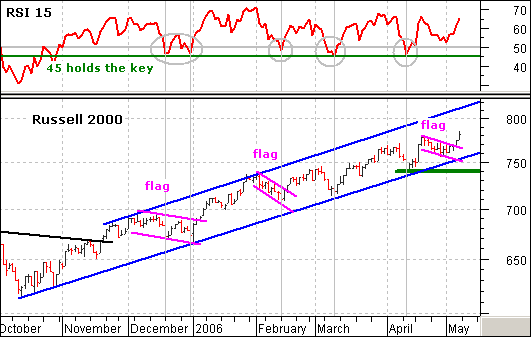
I also use RSI to gauge the strength and direction of the long-term trend. This key momentum indicator moved above 50 in early November and then held above 45 in December, February, March and April. There is clearly lots of support at 45. As long as RSI holds 45 and the index holds the lower channel trendline, the flag breakout is bullish and we should expect further gains.
In addition to using RSI for the long-term trend, it can be used to identify playable pullbacks within the trend. Notice that RSI bounced after each pullback below 50 (gray ovals) and these dips represented excellent opportunities to partake in the bigger uptrend. RSI held above 50 on the most recent pullback (falling flag). The shallowness of the pullback shows underlying strength and I expect further gains.


