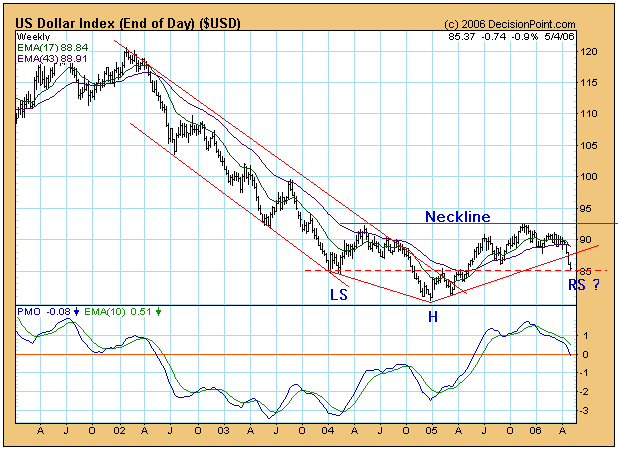
On March 17 our trend model turned from bullish to neutral on the US dollar, and since then the technical picture has continued to deteriorate. Prices have dropped precipitously from near 90 to near 85, and the weekly 17-EMA has crossed down through the 43-EMA, a long-term sell signal. (The weekly moving average crossover is not "official" until the end of the week, so the sell signal could be erased if there is a sharp rally on Friday.) The weekly moving average crossover is a big deal, because, as you can see on the chart below, it doesn't happen very often.
While price action and internals are negative, there is the possibility that a bullish reverse head and shoulders is forming. There is a clear left shoulder and head, and the support line at 85 could facilitate the formation of a right shoulder. If the dollar can rally off the support at 85, we would want it to rally up through the neckline drawn at 93 in order to execute the pattern. There is no guarantee that this will happen, but it is a possibility.
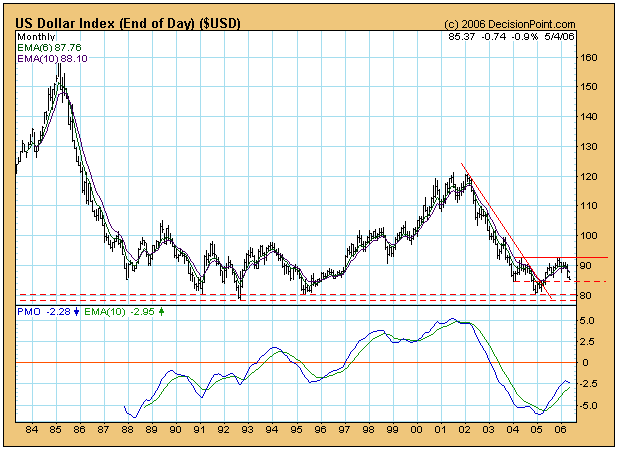
The next chart is a long-term view of the dollar using a monthly chart (each bar equals one month), and it shows another set of positives and negatives. Starting with the negatives, the monthly PMO has topped, and the 6-EMA has crossed down through the 10-EMA. Both are long-term sell signals.
On the positive side, we can see that there is very strong long-term support between 78 and 80. If the reverse head and shoulders pattern fails to execute, it could be that the current decline will lead to a double bottom on the support around 80 in preparation for a strong upside trend reversal.
Bottom Line: We are currently neutral on the dollar, and the technical condition of the index is negative; however, support zones at 85 and 80 could provide a solid basis for a long-term bottom. Sentiment shows the lowest percentage of bulls since late-2004, so a short-term bounce is likely very soon.


