During the last two weeks the market has experienced a much needed (and long anticipated) decline, and now it is due a bounce out of a short-term oversold condition; however, the decline could continue for a few more months.
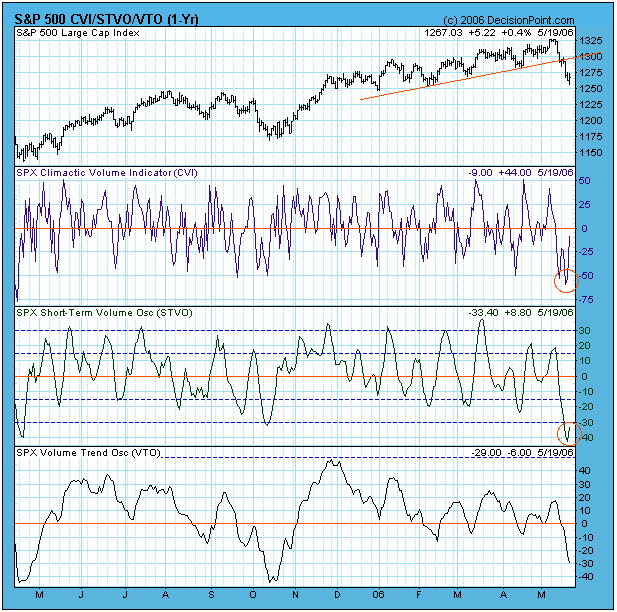
On our first chart below we can see that the CVI (Climactic Volume Indicator) and the STVO (Short-Term Volume Oscillator) have reached deeply oversold levels and have turned up. This is a pretty good indication that a short rally could be starting.

Also, note the rising trend line I have drawn on the chart. For several months it has acted as support as the market worked its way higher. Unfortunately, that line has been decisively penetrated, and it will now function as overhead resistance. My guess is that any rally will not exceed 1300 on the S&P 500.
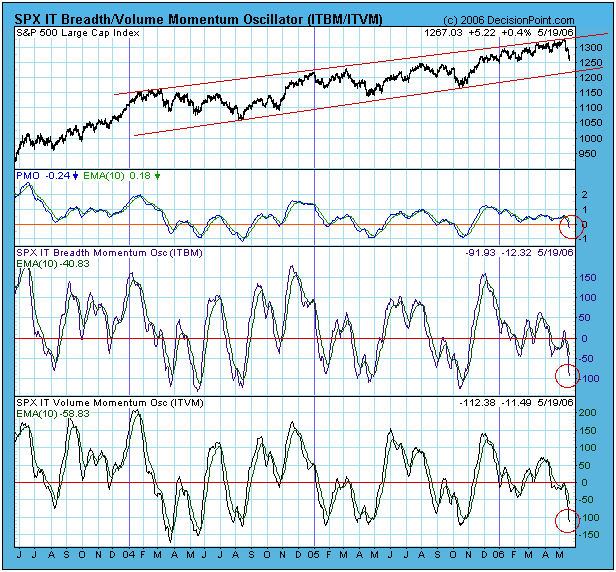
The next chart shows three of our primary medium-term indicators -- one each for price, breadth, and volume. The ITBM (IT Breadth Momentum) and ITVM (IT Volume Momentum) Oscillators have become modestly oversold, but the PMO (Price Momentum Oscillator) has only just passed through the zero line and is nowhere near the level where other declines have ended. Also, the violation of the short-term rising trend line suggests that the decline will continue at least to the bottom of the medium-term rising trend channel.

The best-case scenario is that the decline will end once the PMO, ITBM, and ITVM turn up from oversold levels, which might only take a few more weeks; however I want to call your attention to the March-August 2004 correction. Note that indicators (and the market) made three oversold bounces before the correction was finally over.
Bottom Line: An oversold bounce can be expected, but there is plenty of room (and need) for a continued decline longer-term. Our primary timing model for the S&P 500 switched from buy to neutral on Friday, so I am inclined to believe we are in for some rough sailing over the next several months.


