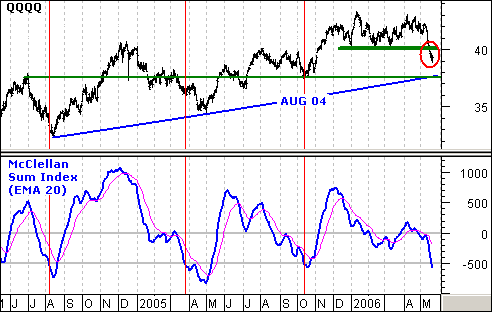
QQQQ established support at 40 with three bounces over the last six months and broke this key support level with a sharp decline over the last two weeks. The break below 40 signals a major victory for the bears and the first downside target is to around 37-38. The August 2004 trendline and October low mark support in this area.
The decline was enough to push the McClellan Summation Index into oversold territory. This version of the McClellan Summation Index is based on the stocks in the Nasdaq 100 and is directly related to QQQQ. This is the fourth dip below –500 in the last two years. However, the indicator has yet to firm and rebound. As long as it remains below –500 and below its 20-day EMA, breadth is deteriorating and this oversold indicator could become even more oversold. As long as its remains oversold, I would look for further weakness towards support around 37-38 for QQQQ.
A lot of damage has been done over the last two weeks and it will take some time for the bulls to regroup. Before calling for a sustainable rebound, I would like to see the McClellan Summation Index move back above –500 and its 20-day EMA.