The Dow came down hard in May, but found support at 11050. This support level stems from January resistance and the April low. A key tenet of technical analysis is that broken resistance turns into support. The Dow broke above 11050 in February and this level turned into support in April and May.
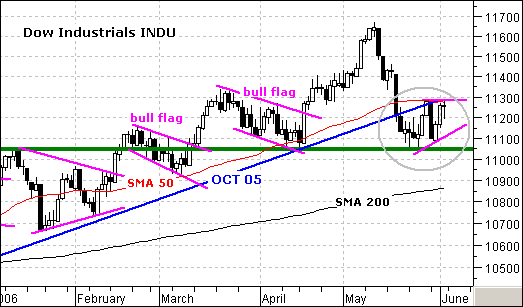
Since reaching support, the Dow consolidated over the last two weeks and a pennant type consolidation is forming (gray oval). The sharp decline created an oversold condition and the Dow needed to work off this condition. A two week trading range is just the trick, but the pennant is a bearish continuation pattern. A move below the May low would confirm the pennant and call for a continuation of the May decline. The obvious target is the 200-day moving average around 10850. It is also worth noting that the Dow was the only major index NOT to move back above its 26-May high on Thursday and this shows relative weakness. The S&P 500, Russell 2000 and Nasdaq all surged above their 26-May high on Thursday.
For a bullish resolution to this consolidation, I will be watching resistance at 11300. This resistance level stems from the 50-day moving average, the 26-May high and the October trendline extension. The October trendline provided support until May and now acts as resistance. A break back above 11300 is needed to put the Dow back into the bull mode.
