"Summer-time... and the trading's easy!" Sorry for the singing folks, but we are in a happy mood here at StockCharts right now. Summer time always cheers people in the Pacific Northwest up (I wonder why? ;-). We're so happy that we decided to roll out our Summer Special this week! That's right, sign-up (or renew) now for any our of long-term subscription packages and get extra time for free: 1 free month for a 6-month subscription, 2 free months for a 12-month subscription. This is our best deal ever so don't let it pass you by! Click here to get started.
Also this week we're giving you a double-dose of John Murphy. First, we've got an high-level piece that John wrote about the Bullish Percent Index and what it says about the rest of the year. After that, we have a link to John's most recent presentation to the New York Board of Trade (NYBOT). In my opinion, both of these items show John at his best. If you agree, I encourage you to consider subscribing to John Murphy's Market Message service and get John's insights throughout the year. (And remember, now that we are running our Summer Special, you can subscribe to John's commentary at the best price we've ever offered!)
BULLISH PERCENT INDEX SUGGESTS A BEAR - John Murphy
The most difficult thing to determine in market analysis is the difference between a market correction and the start of a bear market. They look pretty much the same. Prices fall to an area of chart support (usually around the 200-day moving average), get oversold, and start to bounce. In most cases, that's the end of the correction and another upleg starts. In rarer situations, the initial decline is just the first phase of a bear market. After the oversold bounce has run its course, the market starts down again. We now appear to be at the point where the market has suffered a sharp setback and is starting a rally attempt. Short-term indicators only tell us about the short-term trend which is oversold at the moment. That's why I've been relying on longer-term indicators to determine the seriousness of the recent market slide. One of those is the Bullish Percent Index. The purple line on the chart below is an updated version of the BPI for the S&P 500 while the green line is the S&P 500 itself. [The BPI is the number of stocks in an index that are in point & figure uptrends]. My concern in early May was that the BPI was falling while the S&P 500 was hitting a new high (see arrow). That type of negative divergence is usually a bearish sign for the market and give a correct warning of the market's May downturn. A closer analysis of the BPI line suggests that the recent decline may be more that just a downside correction.
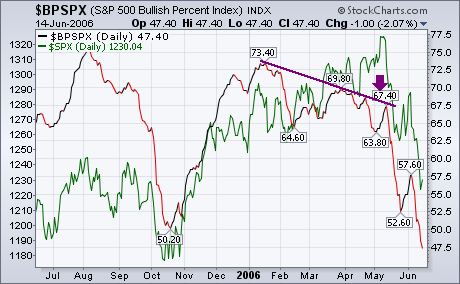
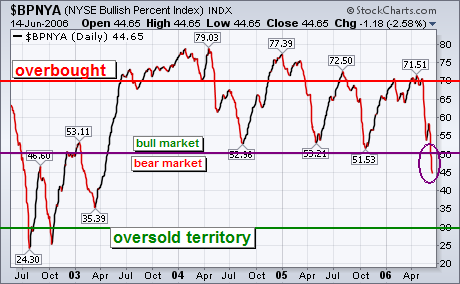
BPI FOR NYSE FALLS BELOW 50... That chart shows the BPI for the S&P 500 falling below 50 and undercutting the low formed last October. That's a bad sign for the market on both counts. To show why that is, however, I'm going to use the Bullish Percent Index for the NYSE Composite Index because that's the measure generally used for market analysis. Since the NYSE includes all stocks traded on the NYSE, it's also a broader measure of market trends. The next chart shows a chart of the BPNYA for the last four years. The general guidelines are these: readings over 70 (red line) warn of an overbought market condition. Major market tops usually begin from over the 70 level. Major market bottoms usually begin from below 30 which marks a major oversold condition (green line). The last time the BPNYA fell below 30 was in the fourth quarter of 2002 when the market hit bottom. Every downside correction that's occurred since the start of 2004 has started with readings over 70 (including the last one). The question before us is whether this is just another downside correction or something more serious. Which brings us to the middle line at 50. As I explained on May 6, the 50 level is the dividing line between bull and bear markets. As long as more than half of NYSE stocks are in uptrends, a bull market exists. When less than half are in uptrends, a bear market exists. The last time the BPI line crossed over 50 was in the spring of 2003 when the cyclical bull market began. The three market corrections since the start of 2004 bounced off the 50 line which acts as support during market pullbacks. This time, however, it is different. The BPI line has fallen below 50 for the first time in three years (see circle). That suggests to me that the recent market decline is more likely the start of a cyclical bear market than a normal downside correction.
- John Murphy
