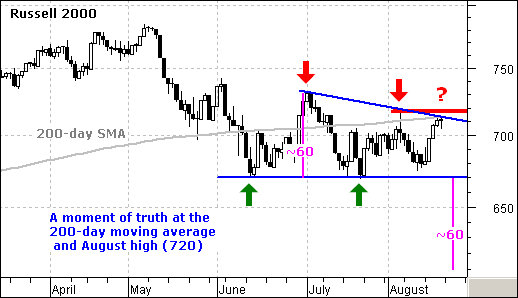
The Russell 2000 has been lagging the S&P 500 and Nasdaq 100 over the last few months. Even with the big bounce off support this past week, the Russell 2000 remains below its August high. In contrast, the S&P 500 and Dow broke above their June highs this week and the Nasdaq broke its early August high this week. With a lower high in early August, the Russell 2000 traced out a bearish descending triangle (blue trendlines) and a break below support would signal a continuation of the current downtrend.
What exactly is a descending triangle? This pattern forms with a series of lower highs (red arrows) and equal lows (green arrows). The lower highs reflect rallies that were weaker and weaker. Buyers were not able to push prices above the prior peak and this shows weakness. The equal lows represent support and this is the place where buyers are still strong. A break below support would mean that sellers overwhelmed buyers and further weakness would then be expected. Based on traditional technical analysis, a break below support at 670 would target a decline to around 610. This downside target is found by subtracting the length of the pattern (60) from the break point.
It ain't broken until it's broken. The Russell 2000 remains between a rock (670 support) and a hard place (720 resistance). A break above 720 or below 670 is needed to break the deadlock and establish a directional signal. The 200-day moving average, July trendline and early August high mark resistance here and a breakout would be bullish. Should the index fail and form another lower high, keep an eye on descending triangle support at 670 for a bearish signal.

