The Nasdaq 100 Index has declined farther than the broader indexes, and it has been slower in turning around; however, this week the index has turned the corner, and appears ready for a continued advance. The only problem is that it has become short-term overbought.
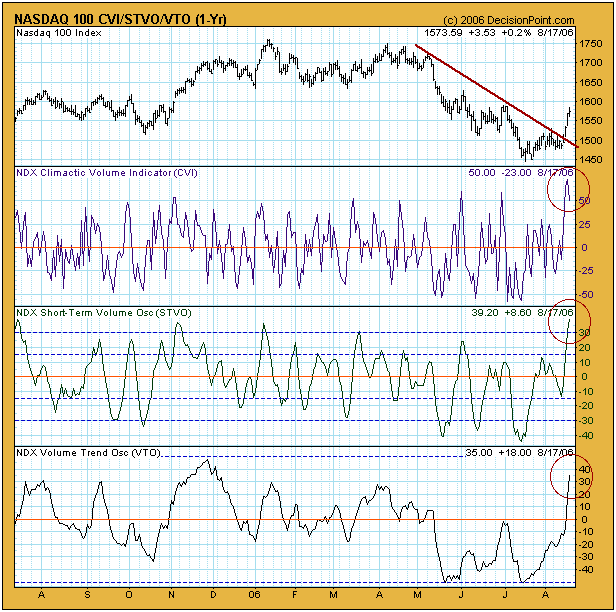
To demonstrate, let's look at the first chart which presents our On-Balance Volume (OBV) Indicator Set. The Climactic Volume Indicator (CVI) measures extreme OBV movement within the context of a short-term OBV envelope for each stock in the index. The Short-Term Volume Oscillator (STVO) is a 5-day moving average of the CVI. The Volume Trend Oscillator (VTO) summarizes rising and falling OBV trends. These charts tell us if the index is overbought or oversold based upon volume in three different time frames.
The first obvious feature is the price breakout above the three-month declining tops line, which signals that the trend is turning upward. Next we can see that the CVI and STVO have both hit their highest level in a year. While this is evidence of the short-term overbought condition, it also implies that an initiation climax has occurred, an event that signals the beginning of a rally.
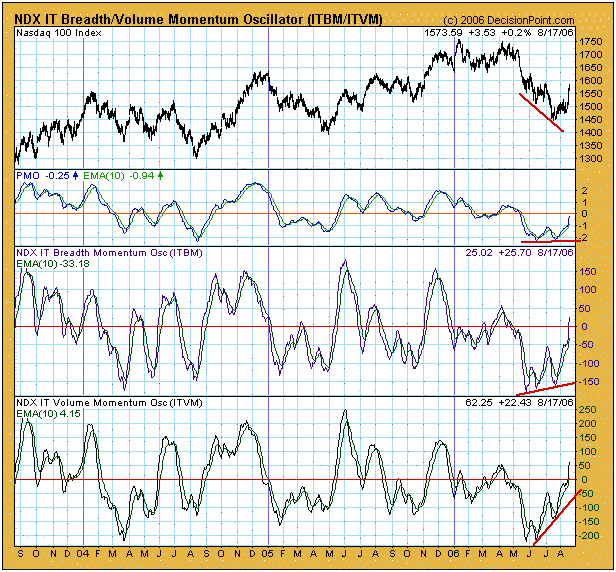
While the short-term overbought condition tells us to expect some pull back and/or consolidation, the second chart presents a positive intermediate-term picture. It displays our three primary intermediate-term indicators for price, breadth, and volume. As you can see, while the price index was making a series of new lows, the three indicators were either flat or trending upward, forming positive divergences. Also, you will note that all three indicators have been moving up from very oversold levels, and they have a long way to go before they become overbought.
Finally, most sentiment indicators we follow continue to reflect strong pessimism, which is bullish for the market.
Bottom Line: Currently, the indicators show us that the trend is turning up. Short-term conditions call for a "pause to refresh," but, once a short correction/consolidation is complete, intermediate-term conditions allow for the rally to continue for at least a few more weeks. Technical analysis is a windsock, not a crystal ball. Be prepared to adjust your tactics if conditions change.


