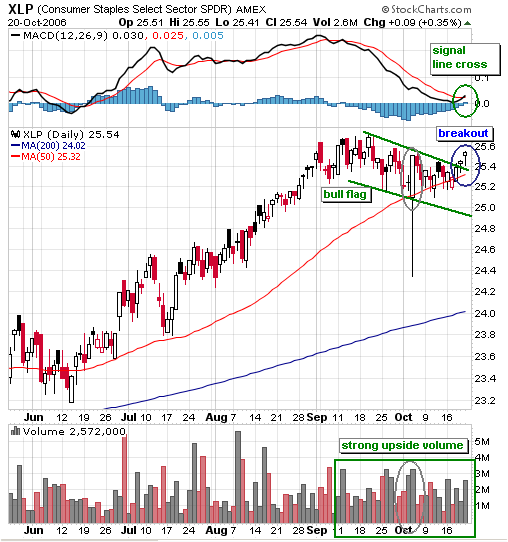
The Consumer Staples SPDR (XLP) was a top performer from April to September, but went through a period of underperformance over the last 4-5 weeks. The Dow Industrials and S&P 500 kept right on trucking in September and October. The Dow recorded a new all time high above 12000 and the S&P 500 is trading at levels not seen since February 2001. In contrast, XLP is trading below its September high and has not kept pace with the Dow or S&P 500 in recent weeks.
Despite this underperformance, the decline over the last few weeks looks like a bull flag (green trendlines). I elected to draw through the spike low on 4-Oct. Bullish flags slope down and act as minor corrections. XLP recorded a 52-week high in early September and the long-term trend is clearly up. Relatively small declines should be viewed as corrections when the long-term trend is up.
XLP declined to around 25.1, firmed just above 25 and broke flag resistance this past week. The breakout reinforces support at 25 and projects further strength above the September high. In addition, momentum is rebounding as MACD moved above its signal line and upside volume has been strong the last few weeks. Strong upside volume, a MACD crossover and a flag breakout all point to higher prices ahead for XLP.


