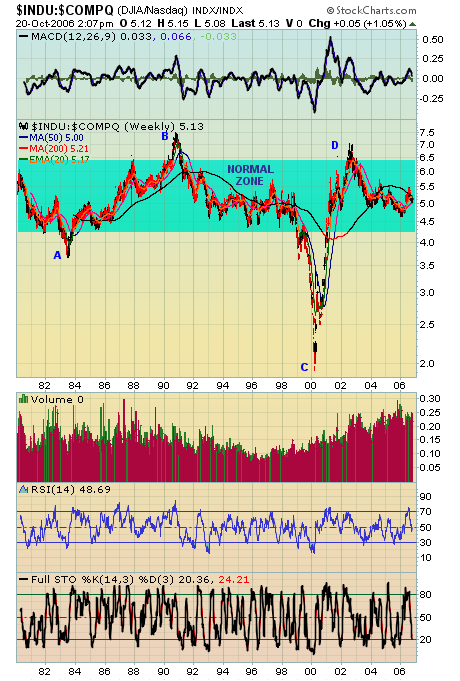
Recall in my last article the "axis of normal returns" showing the potential move of the NASDAQ over the next 2-3 years to return to its "normal line". This time I'd like to approach the NASDAQ's potential move from another angle - studying the relationship that has existed between the Dow Jones Industrial Average and the NASDAQ over the past 26 years. We all hear the phrase "flight to safety", but look at the chart below to get a visual picture of what happens when the more "aggressive" NASDAQ leads the market versus what happens when there is a "flight to safety" to the Dow. Point A on the chart in 1983 shows that the Dow Jones/NASDAQ ratio (hereinafter referred to as the Flight To Safety Ratio, or FTS Ratio) dropped to a low of 3.7, below the "normal zone" where the FTS Ratio has generally been situated during the majority of the time frame reviewed. Once the bear market of 1984 hit, the 7 year flight to safety culminated in 1991 with the FTS Ratio peaking at 7.5 (Point B), meaning that the Dow Jones traded at 7.5 times greater than the NASDAQ in terms of index points. After the 1991 peak, the NASDAQ enjoyed a 9 year period of outperformance over the Dow that ended in March 2000, with the FTS Ratio dropping to an all-time low of less than 2.0 (Point C). When the bubble burst, there was a rush out of equities, but the bleeding was far deeper on the NASDAQ as the FTS Ratio cleared the upper end of the "normal zone" once again, peaking at 7.0 (Point D) in 2002.
So where does the FTS Ratio go from here? Well, if it follows recent history, we'll see the next break out of the "normal zone" to the downside over the next couple years, perhaps to 3.50-4.00. That could coincide with a NASDAQ 4000-4500, right on the "axis of normal returns". Yes, I'm very bullish the NASDAQ.


