Hello Fellow ChartWatchers!
Did you know that this is the most important time of the year for ChartWatchers that are looking to invest for the mid- to long-term? It is. Mention the month October to many investors and you will see them grow pale. "What about the 554 point drop in the Dow back in 1997?" they will ask. "What about the crash of 1987? And the one in 1929?" However, according to the Stock Trader's Almanac, October, the month that is universally loved by Bears and loathed by Bulls, has been the best performing month for the last eight years in a row! And, over the past 15 years, October has had the best total percentage gain (33.5%) for the S&P 500 of any month.
While impressive, those stats aren't the only reason that ChartWatchers should be observant right now. October is also the transition month from the worst performing six months of the year to the best performing six months. Many long-term systems used to say "Buy on November 1st and sell on April 30th" - now they say "Get a jump on things by looking for a good entry point in October." Just another example of the market always adjusting to try and "improve" on any well known timing system.
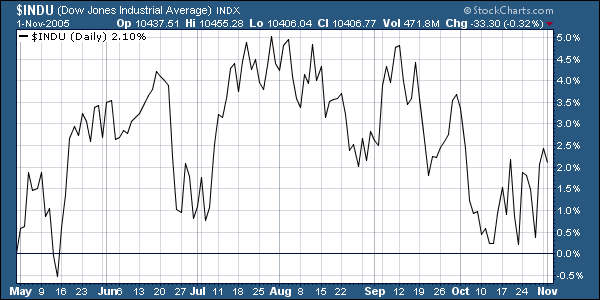
Let's see how this simple 6-month timing strategy played out last year. Here's the performance of the Dow during the "Summer Doldrums":
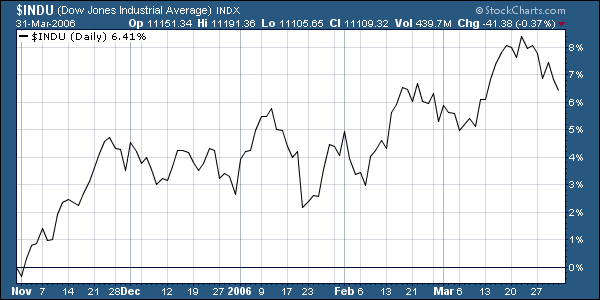
And here's what happened in the six months after that period:
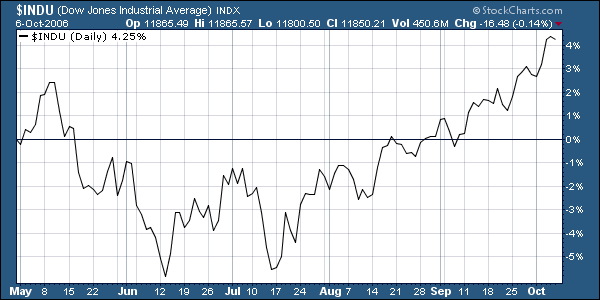
Wow! That's a nice little difference there. Click on the charts to see how they were setup - then go in and change the year settings to see what happened in other years. In general, you'll find that the Winter chart outperforms the Summer chart quite nicely. Which brings us to the current situation:
Hmmm.... so far the "Summer" months are up 4.25% and the Dow is setting new all-time highs again. Will the Winter months outperform the Summer months again this year? To do so, the Dow would have to rise more than 4.5% above it's current all-time high(!). Despite that concern, people that trust in this historically effective system are watching closely for an entry point between now and November 1st.
Note: I'm getting the data about monthly market performance from the latest version of the Stock Trader's Almanac 2007 which has just arrived from the printers. John Murphy and I agree that this is one of the BEST timing guides out there and should have a cherished place on everyone's desk. Want to know if the January effect is real? Want to know the odds that the Dow will rise on any given day? Want to know the best time of the day to place a trade? THIS ALMANAC CAN TELL YOU!
Because we really want all ChartWatchers to have this amazing market tool, I've told our bookstore folks to heavily discount it for the next two weeks. Right now, the Stock Trader's Almanac 2007 is available in our bookstore for only $24.45US - that's over $10.00 less than its regular price! Please, take a moment and order your copy right now. Outside of a subscription to StockCharts.com, I don't know of a better way of improving your investing results.


