For quite a while I have been saying that the rally that began in July has been driven by persistent bearishness among investors. I still think this was a significant element, and it was encouraged by a strong belief that a major decline would be occurring in October in conjunction with the long-awaited 4-Year Cycle trough. Unfortunately for the bears, it appears that the 4-Year Cycle trough arrived early and without much fanfare (because the price decline into the cycle low was not very impressive).
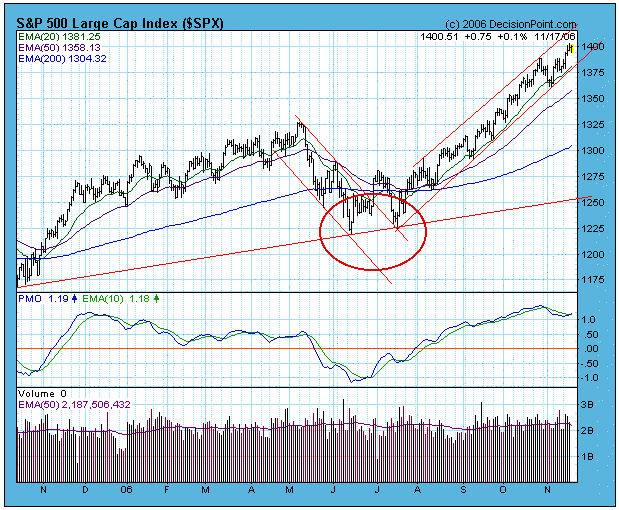
On our first chart we can see that the Cycle trough occurred after a mere 7.5% decline and appeared in the form of a double bottom in June and July.
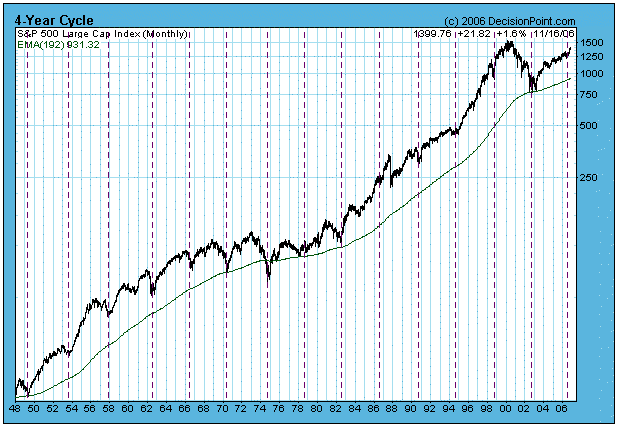
While the Cycle low was easy enough to spot on a one-year daily chart, it shows up only as a small blip on the long-term monthly semi-log chart below. While it clearly fits into the nominal 4-year periodicity, the decline was not nearly as dramatic as many others in the past, and it is easy to see why many investors were fooled into waiting for a deeper decline in the traditional October time frame.
Assuming that my cycle assessment is correct (some will say that it isn't), and assuming that the new 4-Year Cycle unfolds in a "textbook" fashion (it very well may not), it is most likely that we have begun another up leg in the bull market that will last for a few years. While that is a distinct possibility, I personally will not count on it too heavily, because we can clearly see on the chart above that some cycles are far from typical.
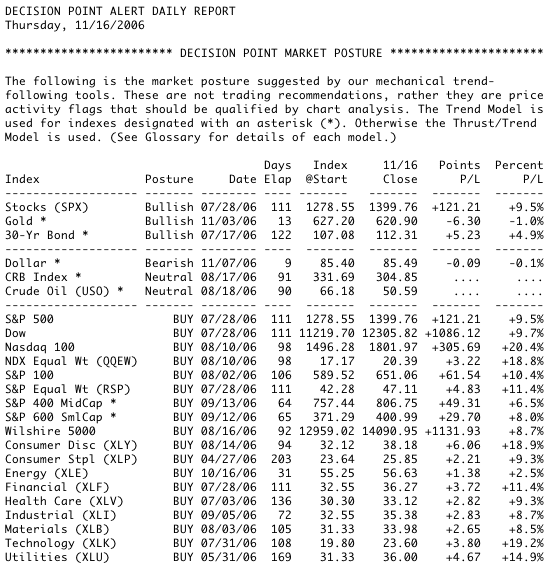
The cycle model can help explain current market action, and it can help us anticipate future price moves; however, rather than try to predict the future, I still find it best to let our trend-following tools/models point the way and drive our decision-making. The table below shows the status of those models as of Thursday.
This table is updated for subscribers every trading day in the Decision Point Alert Daily Report.
Bottom Line: Many investors are still expecting a major decline later this year, but I think that is unlikely because a new 4-Year Cycle is beginning. Prices should remain in an up trend for several months, if the cycle unfolds in a typical fashion.


