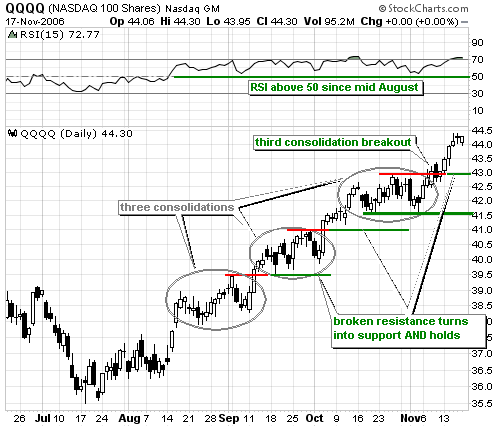
For the third time in three months, QQQQ broke consolidation resistance and the uptrend shows no signs of abating. The gray ovals show consolidations in the second halves of August, September and October. These were followed by breakouts in early September, early October and early November. Broken resistance turned into support at 39.5 in September and again at 41 in October. These breakouts held and QQQQ never looked back. That shows strength.
On the most recent breakout, broken resistance at 43 turns into support and this is the first level to watch for signs of trouble. A strong ETF should hold its breakout and this is exactly what QQQQ did in September and October. A move below 43 would be negative and call for a re-evaluation.
Even though a move below 43 would be negative, I would not turn bearish right away. There is a big support zone around 41.5-43 from the October consolidation. In addition, RSI held above 50 since mid August and this level marks key support for momentum. QQQQ would have to break below the October lows (41.5) and RSI would have to break below 50 to reverse the medium-term uptrend. As long as both hold, the trend is firmly bullish and further gains should be expected. In Dow Theory talk, the trend is in place until proven otherwise and I have yet to see any evidence to the contrary.


