There is a lot more power inside our SharpCharts2 charting engine than we currently make available to our users. The problem is making that power available in an easy-to-use way. A great example of that is the ability to calculate indicators based on something other than the closing value in the underlying dataset. Imagine seeing a MACD display based on a stock's High values rather than it's close. Or image seeing a Bollinger Band plot based on the Lows of the day.
This week we took a step towards providing that level of flexibility by modifying the way that Simple Moving Averages and Exponential Moving Averages work. Now, you can add an optional letter to the end of any moving averages parameter box that will change the data value that we use to calculate the average. If you don't specify a letter, we will use the closing value like we always have.
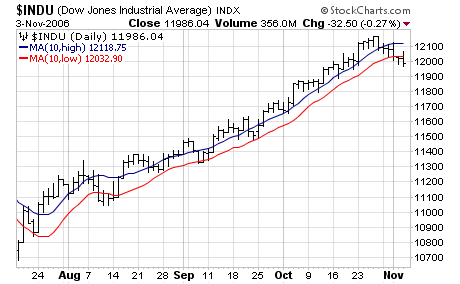
For example, to plot the 10-period Simple Moving Average of the daily Highs for the Dow, use the string "10,H" in the "Parameters" box beside the Overlay dropdown. To plot the 10-period Simple Moving Average of the Lows, use "10,L". Here is an example of what that chart would look like:

You can use the letter "O" for the Open, "H" for the Highs, "L" for the Lows, and "C" for the Close. If you don't specify a letter, the closing values will be used. Again, this new feature only works for Simple and Exponential Moving Averages right now.
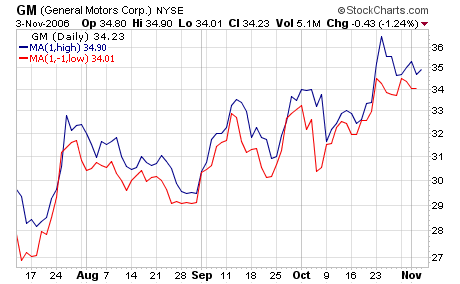
You can combine this new ability with the existing ability to offset a moving average to create some very interesting charts. Here's a chart off the 1-period MA of the Highs and the 1-period MA of the Lows - only the 1-period MA of the Lows is offset by one day. In addition the price bars have been hidden so that they don't clutter things up.

Please experiment with these new options and let us know what you think.


