The Dow Jones Industrial Average had a significant technical development in the middle of last week when it failed to surpass it's previous "peak" for the first time in months. After hitting 12,361 on November 22nd, the index sank to 12,072 a week later. The crucial rebound started on November 29th but stalled at 12,360 on December 5th.
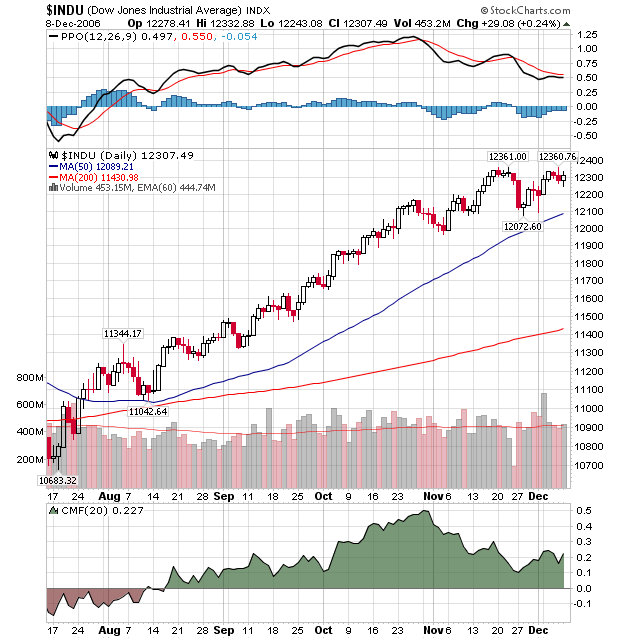
The failure to punch through the 12,360 level is technically significant. It signals the end of the very strong uptrend that the market has been in and the possible start of a reversal or, in the best case, a consolidation period. The key levels to watch for in the coming days are 12,360 on the upside and 12,100 on the downside. A close above 12,360 means this was (hopefully) a temporary glitch and the rally is back on. A close below 12,100 means that the index has reversed and we should expect lower prices.
Finally, Happy Holidays everyone! Our next newsletter will be after the new year.


