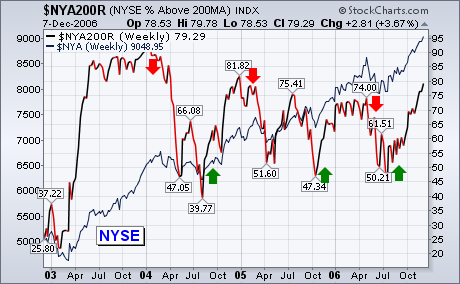
% NYSE STOCKS ABOVE 200-DAY AVERAGES ... I've received requests to look at some long-term market sentiment indicators. I've chosen a couple that you can plot by yourself on Stockcharts. One of those is the % of NYSE stocks above their 200-day moving average ($NYA200R). That's the reddish line in Chart 1 (the blue line is the NYSE Composite Index). As with all sentiment indicators, there are two main considerations. One is the level. At the end of a major bear market (like at the start of 2003), readings below 30 often mark major bottoms. During bull market corrections, however, readings around 50 usually market intermediate bottoms. That was the case in mid-2004, late 2005, and mid-2006. Readings over 80 usually mean an overbought market. That often leads to downside corrections (and, in some cases, major tops). At the moment, the % of NYSE stocks above their 200-day average has reached 79. That's the highest level in two years and puts it very close to overbought territory. But that's not enough to signal the start of a market downturn.
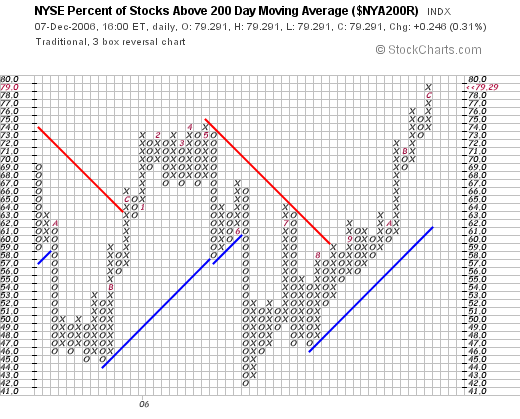
THE TREND IS STILL UP ... As with most things in market analysis, the trend is the most important factor. Chart 2 is a point & figure chart of the same indicator shown in Chart 1. There are two points that jump out at me. One is that the value of this indicator has exceeded its early 2006 which is a sign of market strength. The second is that the trend is still up. The first buy signal was given at 56 during July, and there have been six buy signals since then. [A buy signal exists when an x column exceeds a previous x column. Obviously, the first two or three signals are always the best]. Although the indicator is moving into overbought territory over 80, the trend is still up. The indicator would have to drop to 72 to give an actual sell signal. It would have to fall to 76 to suffer a downside three-box reversal. Although the sentiment indicator is entering overbought territory, it doesn't show any sign of weakening


