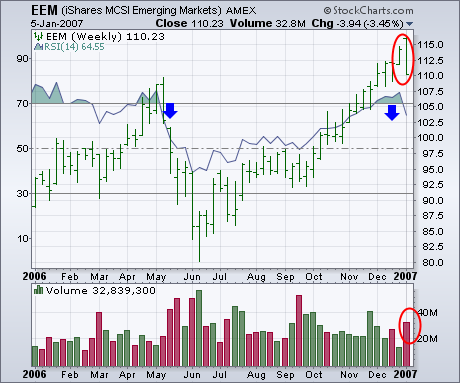
The MSCI Emerging Markets iShares (EEM) suffered a downside weekly reversal on heavy volume as shown in the chart below. In fact, the EEM had its biggest weekly fall in more than three months. At the very least, that suggests that a pullback of some type is probably in store. That cautious view is supported by the 14-week RSI line (blue line) which had been trading in overbought territory over 70 for the first time since last May. The RSI line has fallen below 70 for the first time since the last EEM peak eight months ago. Since emerging markets had been leading the global rally during the second half of 2006, any serious pullback in that group would most likely weaken most other global stock markets – including the US.


