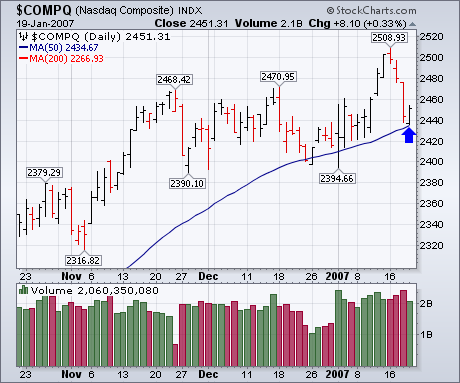
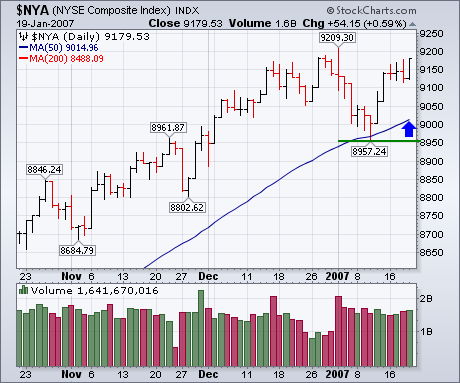
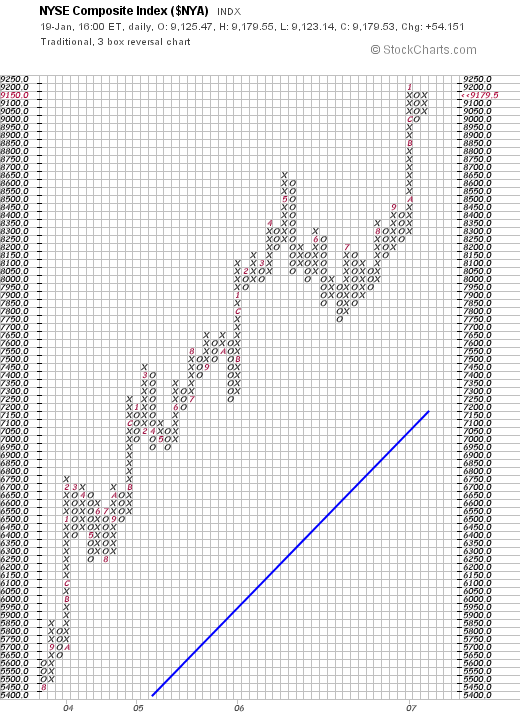
The market closed the week on an upnote. The most important action took place in the Nasdaq market which bounced off its 50-day moving average (Chart 1). Broader market measures have held up much better. Chart 2 shows the NYSE Composite Index ending the week just shy of its old high. It's well above moving average support. It remains to be seen if today's oversold rally in the oil market continues next week and if that causes any short-term profit-taking in the market. Even so, the NYA would have to break its January low to warrant any real concern. Chart 3 ends with a point & figure chart of the NYA. [Each box is worth 50 points]. It shows the continuing uptrend that started at 8050 during June. The NYA needs a close at 9250 or higher to resume its uptrend. It requires a close at 8950 or lower to trigger a sell signal.


