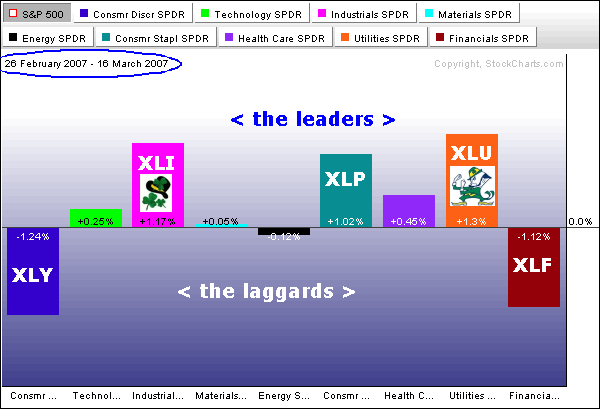
The sector rotations since 26-Feb reflect a defensive and nervous market. Things started changing on Wall Street with the sharp decline on 27-Feb and the PerfChart below shows sector performance since this decline. The Utility SPDR (XLU), the Industrials SPDR (XLI) and the Consumer Staples SPDR (XLP) are the strongest sectors. Strength in XLP and XLU shows a preference for defensive sectors. The Consumer Discretionary SPDR (XLY) and Finance SPDR (XLF) are the weakest sectors and this is not a good sign.
As its name implies the Consumer Discretionary sector represents companies that are sensitive to economic fluctuation. This includes retail, media, leisure, homebuilding and restaurant stocks. These are the first to get hit when there are signs of weakness in the economy. Relative weakness in this sector points to upcoming weakness in the economy.
Finance is the single biggest sector in the S&P 500 and XLF represents the banks and brokers. We are already aware of the sub-prime lending problems and this continues to hang over the Finance sector. The sub-prime problems are probably not enough to bring down the big banks, but continued uncertainty is keeping buyers on the sidelines. The S&P 500 is going to have a hard time rising as long as these two KEY sectors show relative weakness.