In light of this week's sharp decline (mini-crash?), the most obvious subject for discussion in this week's article is to question whether or not we are on the verge of another major crash. In my 12/8/2006 article, Crash Talk Is Premature, I stated:
". . . my analysis of the price structure and internal indicators leads me to the conclusion that there is not a crash anywhere in sight. This does not preclude a crash triggered by an external event of which we can have no advance knowledge, but the visible deterioration that typically precedes a crash does not currently exist."
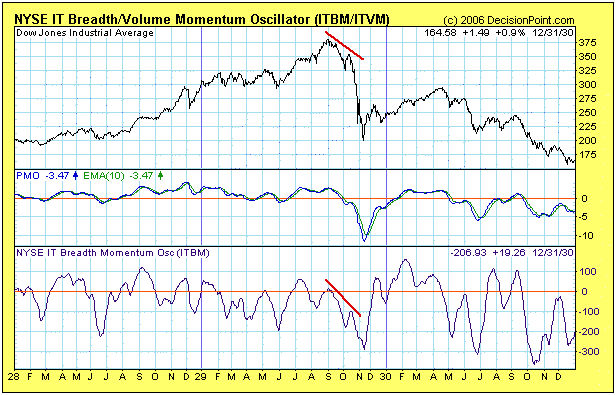
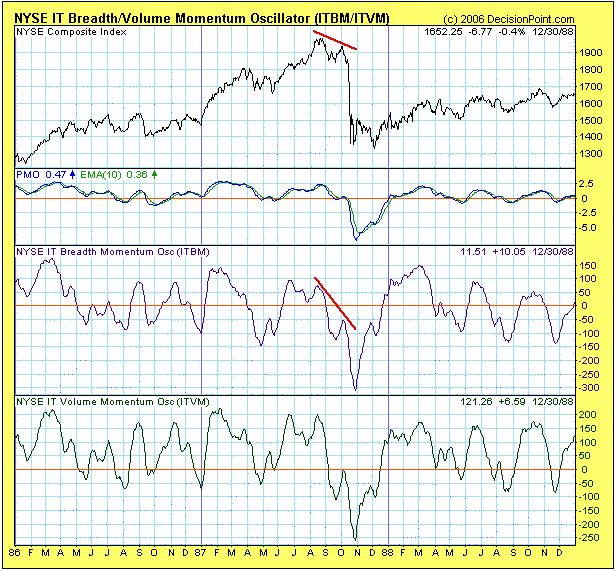
"To illustrate, we can look at charts (below) of the two most famous crashes of the last 80 years – the Crash of 1929 and the Crash of 1987. There are two chart configurations that preceded these two major crashes. First, was the price action – a major price top, followed by a lower top, followed by a break below the price low between the two tops. This kind of event doesn't always lead to a major crash, but it is always a sign of danger, and can be part of a market correction."
"The second element is internal deterioration visible in a breadth indicator. In the case of the two charts below we can see that, when the second price top formed, the ITBM Oscillator also topped, and it topped below the zero line as a result of an extended period of deterioration. Below zero indicator tops are another danger sign that should not be ignored."
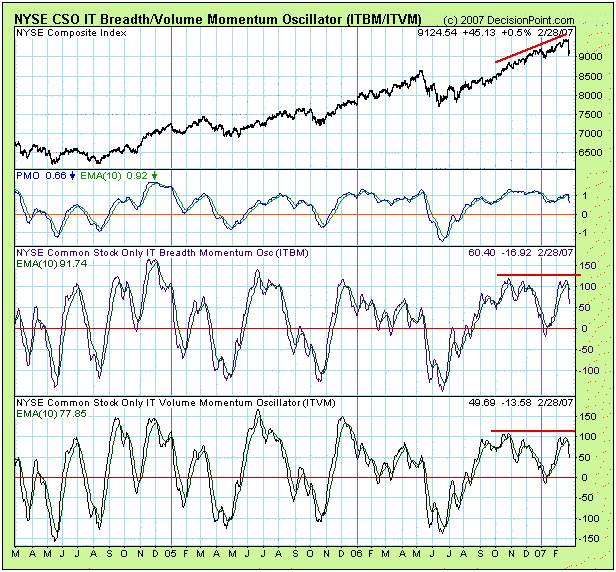
Now let's take a look at a current chart of the ITBM/ITVM Oscillators. We can see that prior to the mini-crash, the indicators were overbought and showing a negative divergence; however, we can also see numerous instances where negative divergences and overbought conditions did not lead immediate, serious declines. In other words, there was nothing on this chart that would hint at a crash. The most logical actions prior to the decline would have been to hold current longs and wait for better (oversold) conditions before opening new longs.
The important point to be made here is that we currently do not have the kind of setup that preceded the 1929 and 1987 Crashes; and, while the recent decline was rather precipitous, the market has only declined about 4% from its recent highs. Having said that, it is unlikely that the correction is over, and continued negative action could indeed lead to a technical setup similar to the ones that formed prior to the Big Crashes.
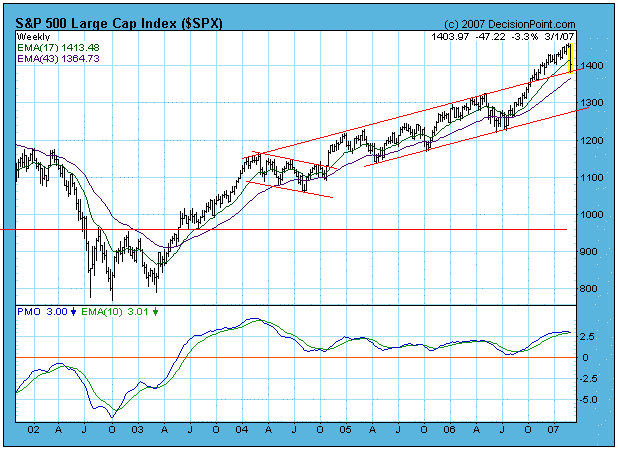
One big positive that the market has going for it is the major support that can be seen on the next chart. The recent rally pushed the S&P 500 above the top of its long-term rising trend channel. Where the top of the channel used to be resistance, it is now support, and the remainder of the correction could be played out above the support line.
Bottom Line: We have gone seven months without a medium-term correction, and, while I am surprised at the violence with which it was initiated, I am not surprised that a correction has begun. I personally do not believe that we are setting up for a big crash or a bear market, but I will be guided by future market action. Regardless of my personal opinion, we rely on mechanical trend models to determine our market posture. Below is a recent snapshot of our primary trend-following timing model status for the major indexes and sectors we track.


