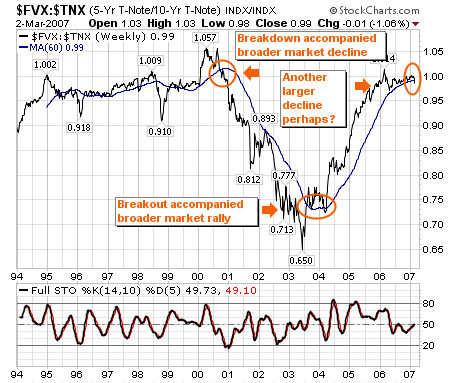
Last week's market decline was quite interesting from a number of perspectives. First, the decline clearly mirrors the movement in Japanese Yen as the "carry-trade" is unwound; if one watches these closely, one will see that stock traders are cleary focused on the yen. We will have more to say on this in the future; but suffice to say, a major reversal higher in the yen has taken place. Secondly, and perhaps more importantly from an economic perspective in the US - is that our simple interest rate model of the ratio between the 5-year note and 10-year note ($FVX:$TNX) has broken important support at its "fulcrum point" of its 60-week moving average. Over the past 10-years, this model has generally kept one long during corrections if it is above its 60-week moving average; but for the first time since September-2001...it has broken below its 60-week moving average after attaining the 1.0 level. What we think the market fears is not "inflation", but slowing growth. And this is exactly what happened during the 2001-2002 broader market decline; and we all know just how "deep" and "gut wrenching" that bear market was. Thus, the odds of this decline being more than just a normal correction have increased given the interest rate model. Those who have followed it have done well. Our strategy at this point is to "short rallies" going forward until "the facts change".