The put call ratio ("PC") is quite simply the total number of put options divided by the total number of call options. These options include both individual equity options and index options. Every day you can monitor the relationship between put options and call options at www.cboe.com. Once in the site, click on "Data", then "Intra Day Volume". Every half hour, the information is updated. This article is not the appropriate forum to discuss options strategies and definitions, but in its most basic form, put option buyers are expecting the market to decline and call option buyers are expecting the market to advance. The PC gives you a quick, concise picture of the relationship between the put buyers (bears) and call buyers (bulls). The beauty of the PC is that it's a contrarian indicator. When the put call ratio spikes above 1.0, it indicates the market is becoming oversold short-term so expect a rally. When the PC drops below 0.6, the market is becoming overbought short-term so expect a decline. I like to use the 5 day and 21 day moving averages of the PC. Any time the 21 day moving average of the PC approaches 1.0, start looking for a bottom in the market. Historical PC data is available at CBOE beginning in 1995. Let's take a look at how this reading of investor sentiment could have been used to identify recent bottoms in the S&P 500 chart.
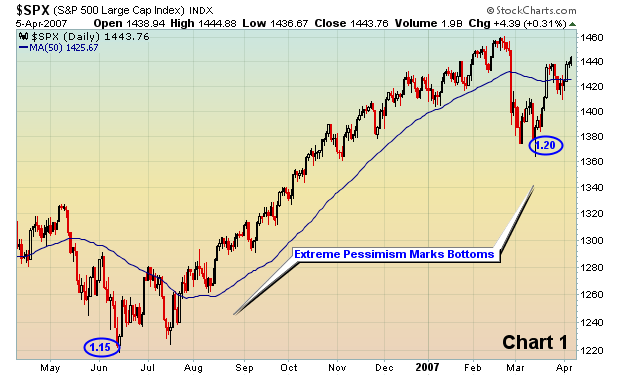
Notice that both bottoms formed when the PC was at extreme readings. The PC at the recent March lows was the lowest 21 day moving average reading since the data was compiled. That reading is indicative of a long-term bottom, not a long-term top. Major tops are formed when the market is euphoric. The recent extreme pessimism suggests that this bull market still has legs - strong legs. We remain very bullish on equities for the balance of 2007 and into 2008.